
Zoom into a city junction on Google Maps and you may spot a tiny traffic light icon sitting on the intersection. Those traffic lights on Google Maps are one of the app’s quieter layers of information: they mark signal-controlled junctions, so you can tell at a glance which crossings will stop you, which turns cross traffic, and how a route’s rhythm will feel before you drive it. This guide explains where the icons appear, what they do — and just as importantly, what they do not do.
The icons belong to the same family of map furniture as the traffic layer and the busy-area labels. Our busy area explainer covers the busyness side; this article covers the small symbol drivers ask about most.
google maps traffic lights
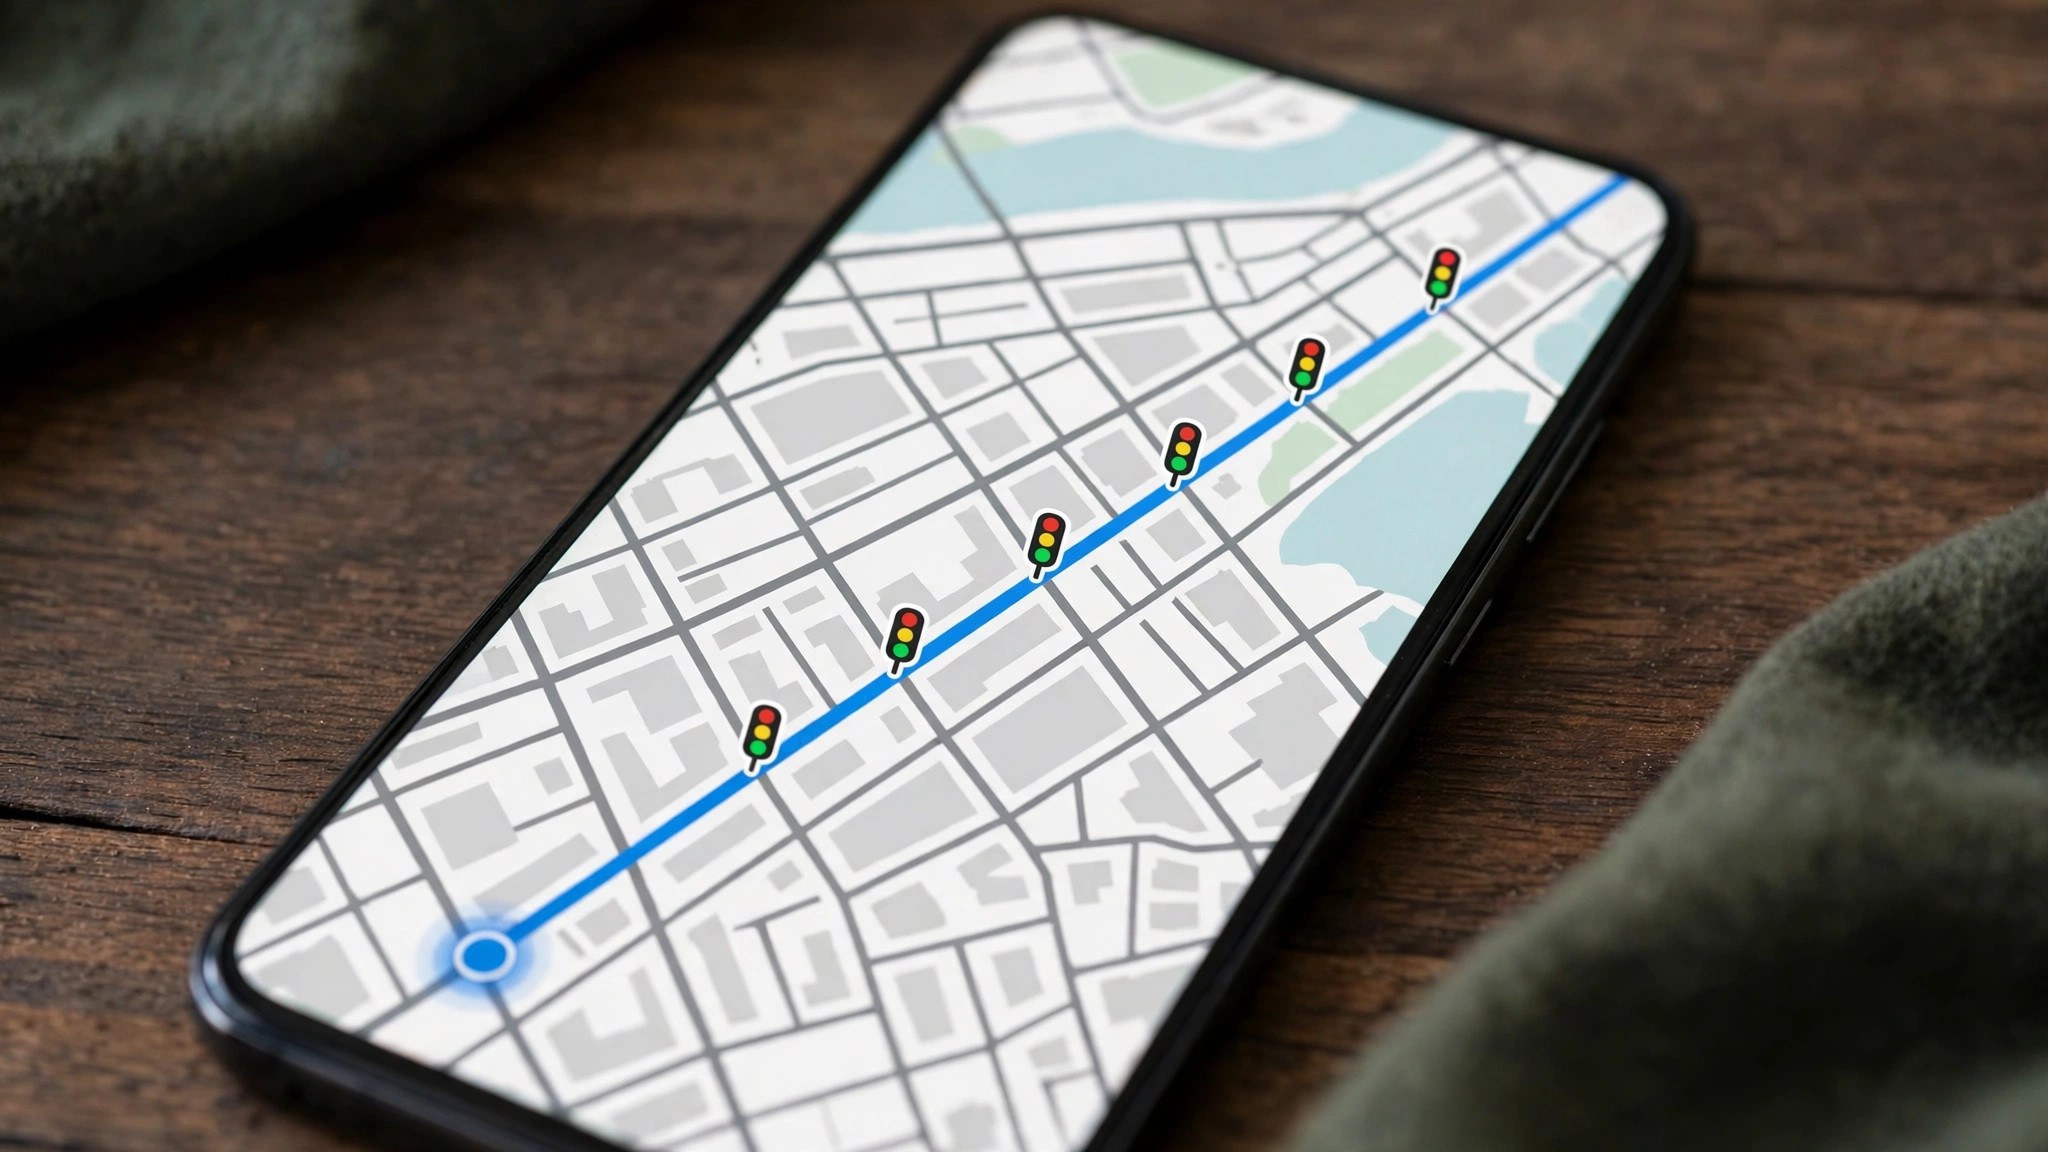
The traffic light icon is a small vertical signal symbol placed at a junction where a real traffic signal controls the crossing. It appears when you are zoomed in reasonably close — at city-street level rather than a whole-city view — and in supported regions it also shows during navigation, so the junctions ahead announce themselves on the route.
A few properties are worth knowing before you rely on it:
- It marks a location, not a state. The icon says “there is a signal here”. It does not say whether the light is red or green right now, and it does not count down a phase. Anyone promising live signal colours from the standard Maps view is describing something the icon does not do.
- Coverage varies. Signal icons rolled out across many cities, the United States first and most completely, and they continue to spread. One city may show them at nearly every junction while another shows none yet — the absence of an icon is not proof of an unsignalised junction, only of missing data.
- It pairs with stop signs in some regions. Where available, stop-sign icons mark all-way stops the same way, giving a fuller picture of where a route will pause.
- It works in browse and navigation modes. Browsing is where you plan; navigation is where the advance warning pays off.
google maps with traffic lights
Why mark signals at all? Because a route is not just distance — it is distance interrupted, and signals are the interruptions. Reading a map with traffic lights shown changes at least four everyday judgements:
- Choosing between two similar routes. A slightly longer road with two signalised junctions will often beat a shorter one with nine. The icons let you count the stops before you commit, something neither the distance nor the headline ETA fully reveals.
- Planning a turn. A right or left turn across a signalised junction is protected in a way the same turn at an uncontrolled crossing is not — relevant when you are new to an area and choosing where to cross a major road.
- Anticipating the ETA’s texture. Maps’ arrival estimates already account for typical signal delays through its traffic data. Seeing the signals explains the estimate: a route dense with icons is a route of stop-start segments, and its time will vary more with the hour than a free-flowing one.
- Walking and cycling judgements. Signalised crossings are the safe crossings. Pedestrians planning a route through an unfamiliar district can chain the icons into a chain of controlled crossing points.
Set beside the Google Maps traffic layer colours, the icons answer the complementary question. The colours tell you how fast traffic is moving now; the signal icons tell you the structural reason the road moves the way it does at this junction, at any hour.
What the icon does not tell you
Honesty about limits keeps the feature useful:
- No live phase information. As covered above, the icon carries no red/green state and no timing. Signal timing data exists in some city traffic systems, but it is not what the Maps icon displays.
- No temporary signals. Roadworks often run temporary lights, and events can add manual control. Neither reliably appears as an icon; the incident symbols from the traffic layer are the signal to watch for those.
- No guarantee of completeness. New junctions, changed layouts and thinly mapped areas can all be missing icons. Treat the map as a strong hint and the windscreen as the authority.
- Not a busyness signal. A signalised junction is not automatically a busy one — plenty of quiet suburban crossings have lights, and plenty of chaotic unsignalised ones do not. For how busy an area actually is, that is the busyness data’s job, not the icon’s.
Reading signals together with live traffic
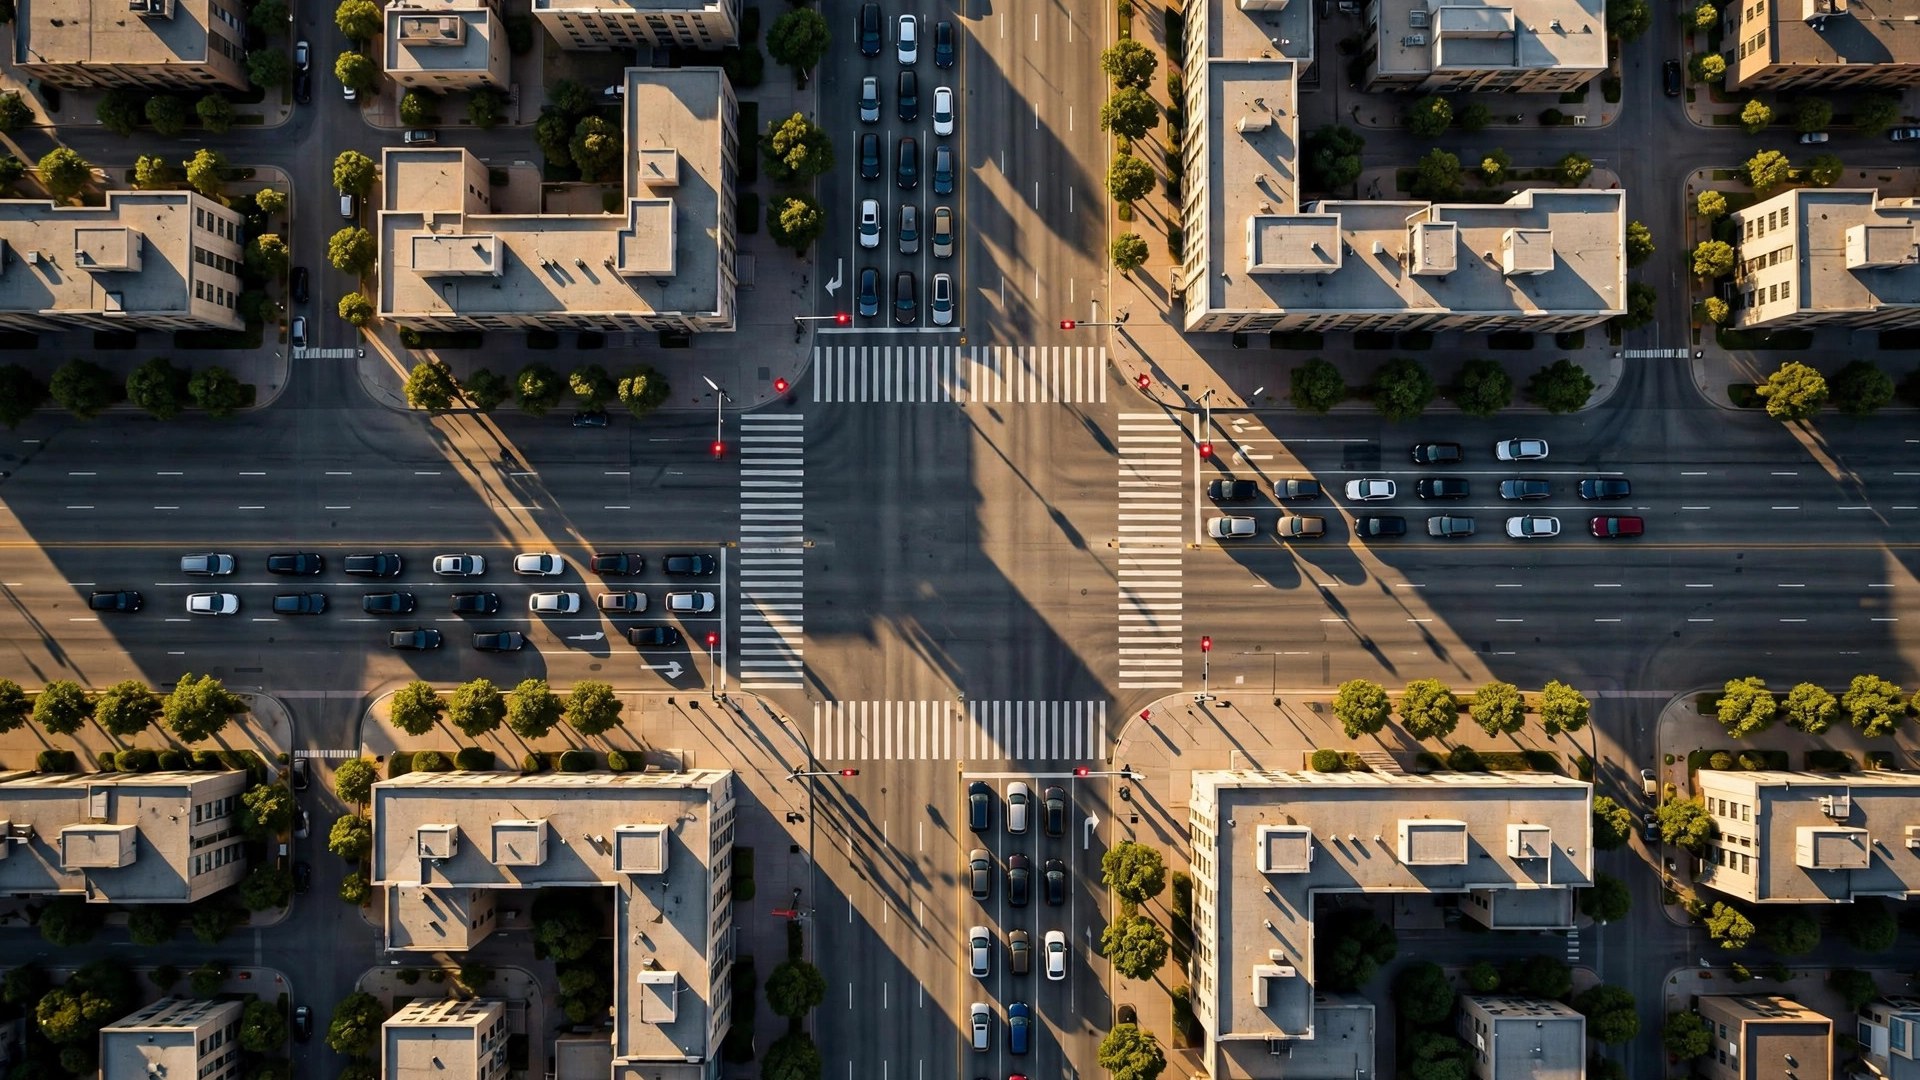
The genuinely useful move is combining the icon with the live layer, the same way this site teaches throughout its guides. Open the live traffic view and zoom to your corridor: a red segment that ends exactly at a signal icon usually means a queue discharging one phase at a time — annoying but rhythmic, and likely to clear in pulses. A red segment with no junction at its head suggests a blockage of another kind — an incident, a merge, a closure — with a different, usually longer, prognosis.
For a learner driver, a delivery round, or anyone planning a route through an unfamiliar city, this combination turns the map into a rehearsal: count the signals, find the queues, and the drive holds fewer surprises. Junction-dense old city centres — in India, think of the signal chains along arterial roads in Delhi, Mumbai or Bengaluru — are where the icons earn their keep most, precisely because the alternative there is discovering each controlled crossing one at a time, at the wheel.
Counting signals: two routes, one honest comparison
Here is the icon doing real work. Imagine two routes across town, both estimated at 22 minutes. Route A follows a wide arterial: 6 km, four signalised junctions, and a long uninterrupted stretch in the middle. Route B cuts through the old centre: 5 km, eleven signals, and three turns across traffic. The ETAs match, but the drives will not feel alike — and the icons, countable in ten seconds, tell you why.
Route A’s time is mostly driving time: stable, predictable, and relatively insensitive to the minute you leave. Route B’s time is junction time: each signal adds a small lottery of waiting, the variance compounds across eleven junctions, and leaving five minutes later can genuinely cost fifteen if the phases line up against you. For a trip with a deadline — a station, a school gate — the route with fewer icons is usually the right choice even at an equal or slightly worse ETA, because it is the route whose estimate you can trust. For a relaxed trip, the centre’s route may be prettier. Either way, the decision is now informed: you have read the map the way the ETA was built.
Delivery and service drivers use this instinctively, choosing signal-light corridors for multi-drop rounds where predictability beats peak speed. The icons simply hand the same information to everyone else.

Why your arrival estimate quietly includes the lights
It is worth pausing on a point many drivers miss: even where no icon is drawn, the signals are already inside your ETA. Google’s travel-time models are built from the actual speeds of vehicles on each road segment, and those speeds include every stop at every light on the segment. The icon is therefore best understood as the explanation made visible, not new data. A segment that crawls every weekday at 6 pm is crawling, in large part, through signal phases — and when the map paints that segment red at 6 pm, the little icons at its junctions are showing you the machinery behind the colour.
This also explains a familiar frustration: a route can show green — no unusual delay — and still involve a dozen stops. Green means “flowing as this road normally flows”, and on a signal-dense street, normal flow is stop-start. The drivers who read both layers, colour and icons together, are the ones who stop being surprised by their own sat-nav.
Turning the detail up: zoom, layers and settings
If you do not see signal icons, work through the short checklist before concluding your area lacks them:
- Zoom in further. The icons render only at close zoom levels; a neighbourhood view hides them by design.
- Use the default map type. Layer and style choices can suppress small furniture; the standard map shows the full set.
- Check a known signalised junction in a major city to confirm the feature works in your app version and region at all.
- Update the app. Map detail features arrive and expand quietly through updates; an old version can simply be behind.
- Look during navigation. In some regions the icons are richer in navigation mode than in casual browsing.
Google’s own documentation of map symbols and layers is the reference here — its guide to using layers and reading map symbols covers the legend the icons belong to, including the traffic colours and incident symbols that sit alongside them.
Frequently asked questions
Does Google Maps show whether a light is red or green?
No. The icon marks that a signal exists at the junction; it does not display the signal’s current phase. Any timing judgement still comes from the traffic layer and the ETA, not the icon.
Why do some cities show traffic light icons and others do not?
Coverage depends on the underlying map data for each region, which Google expands over time. The United States has the deepest coverage; other countries and smaller cities are progressively filled in.
Do the icons appear while navigating?
In supported regions, yes — signals ahead show on the route, which is where most drivers find them useful. Availability still depends on the area’s data coverage.
Can I report a missing or wrong traffic light?
You can suggest a map edit through the app’s feedback tools (“Add or fix a road” / send feedback on the map). Signal infrastructure changes are verified against Google’s sources before appearing.
Are stop signs shown too?
In some regions, yes — stop-sign icons appear at all-way stops in the same style, and the two together give a fair picture of where a route will pause.
The bottom line
Traffic lights on Google Maps are a small icon with a specific, honest job: to tell you where the signals are, so you can count a route’s interruptions before you drive it. They do not show live colours and they are not everywhere yet — but combined with the live traffic layer, they turn an unfamiliar road from a sequence of surprises into a pattern you have already read. Zoom in, count the junctions, and drive the route you meant to drive.
