
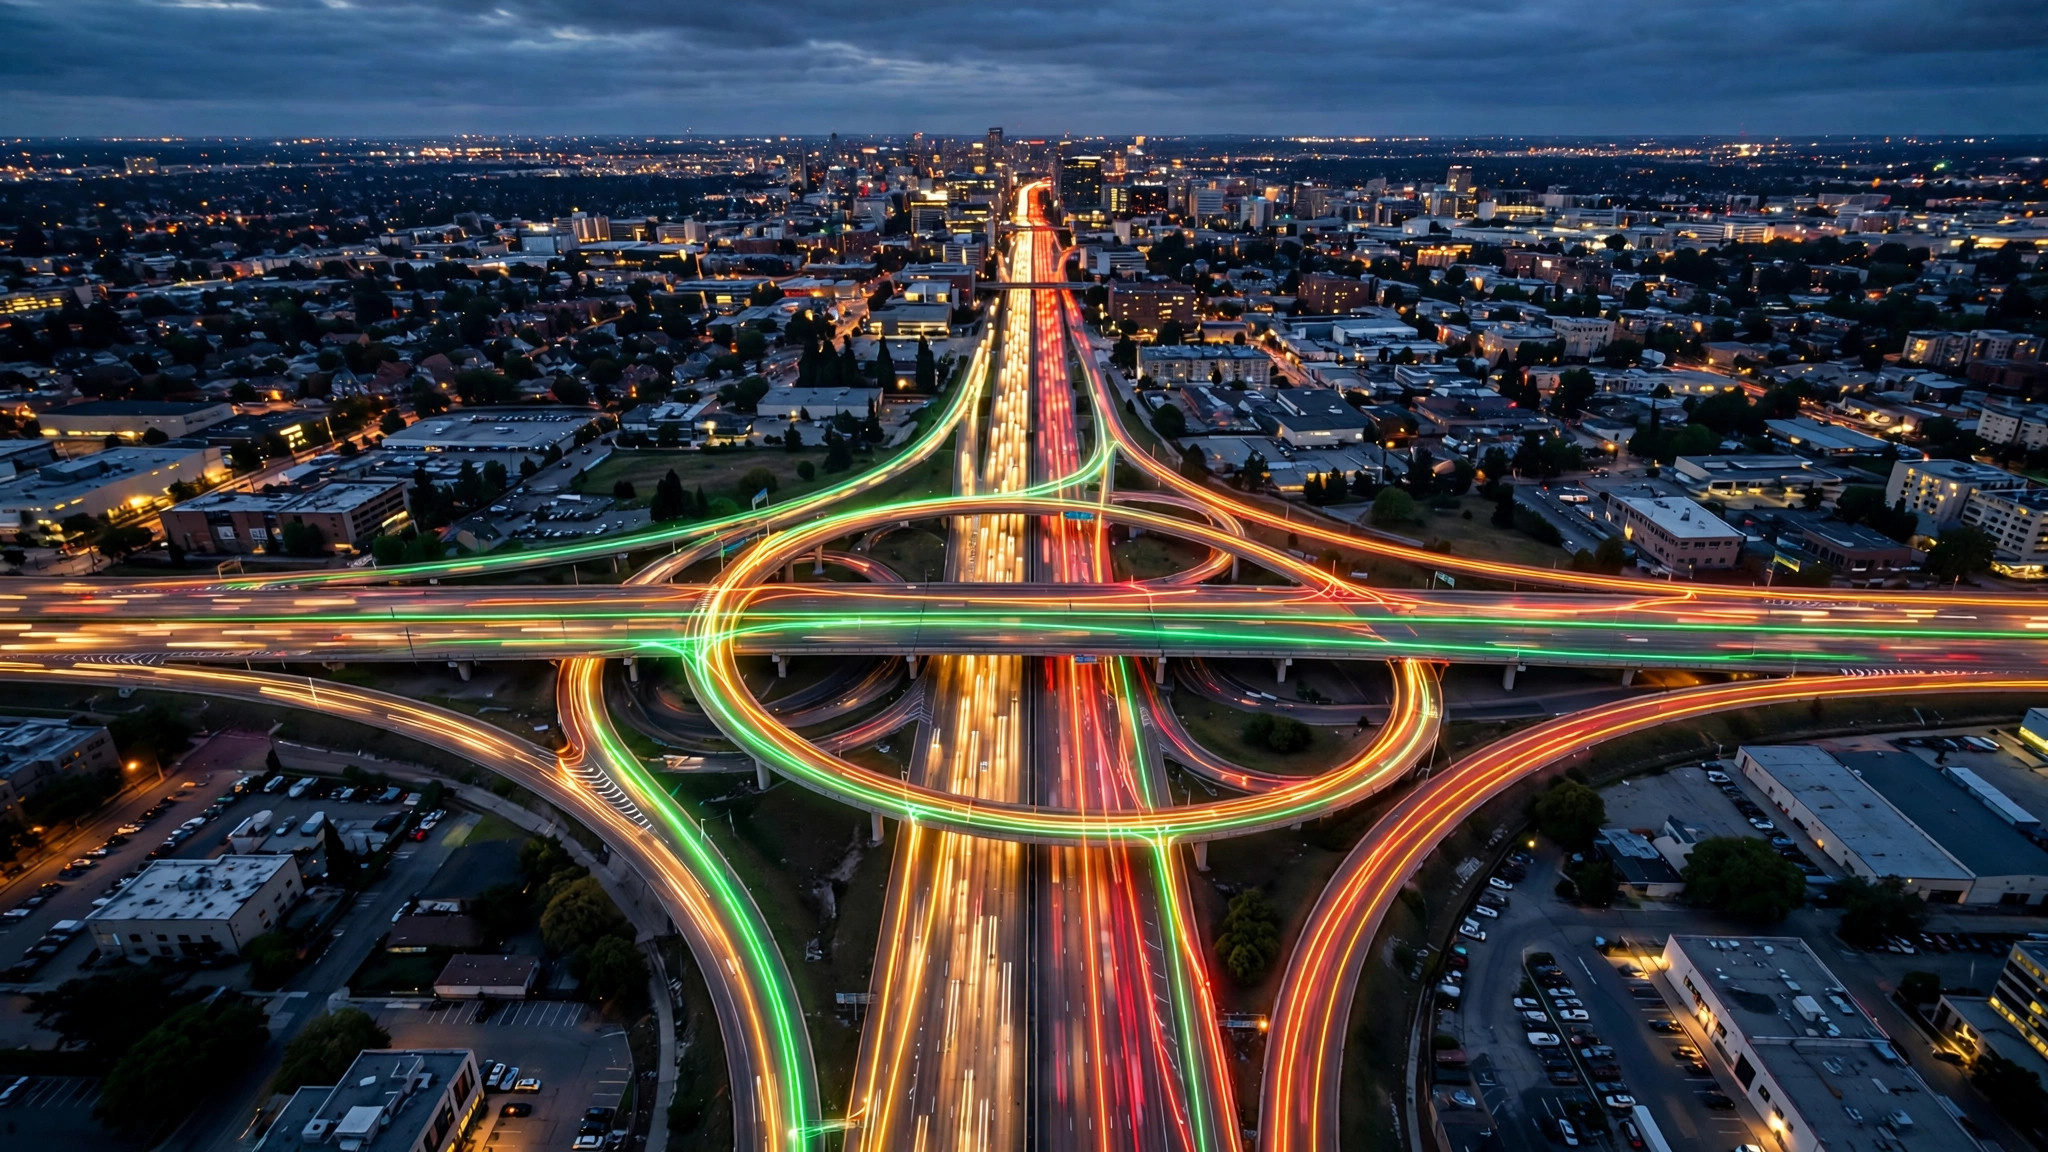
Google Maps traffic is the feature most drivers use and fewest drivers ever switch on deliberately — it arrives with navigation, colours the route, and quietly does its job. But treated as a tool in its own right, the traffic layer is a complete real-time briefing on any city: which corridors are moving, where the incidents are, and which way home is least painful today.
This step-by-step guide covers the whole system: turning the layer on, reading the four colours, decoding every symbol, and checking traffic like a routine instead of an afterthought. If you are newer to the crowd features generally, start with the busy area icon on Google Maps and come back here for the roads.
google traffic
Google traffic is shorthand for the live congestion data Google collects from anonymised phones, road sensors and official feeds, and displays as coloured roads. It is not a separate product — it lives inside Google Maps, powers the ETAs in directions, and leaks into other Google surfaces like Search results for routes and the commute cards on your phone’s home screen.
The data’s great strength is scale. Because so many drivers carry a phone running Google services, most urban roads and highways in most countries are measured continuously. Its great caveat is the same: a road with very few phones on it produces little or no traffic data, and the map honestly shows nothing there rather than inventing a colour.
google traffic map
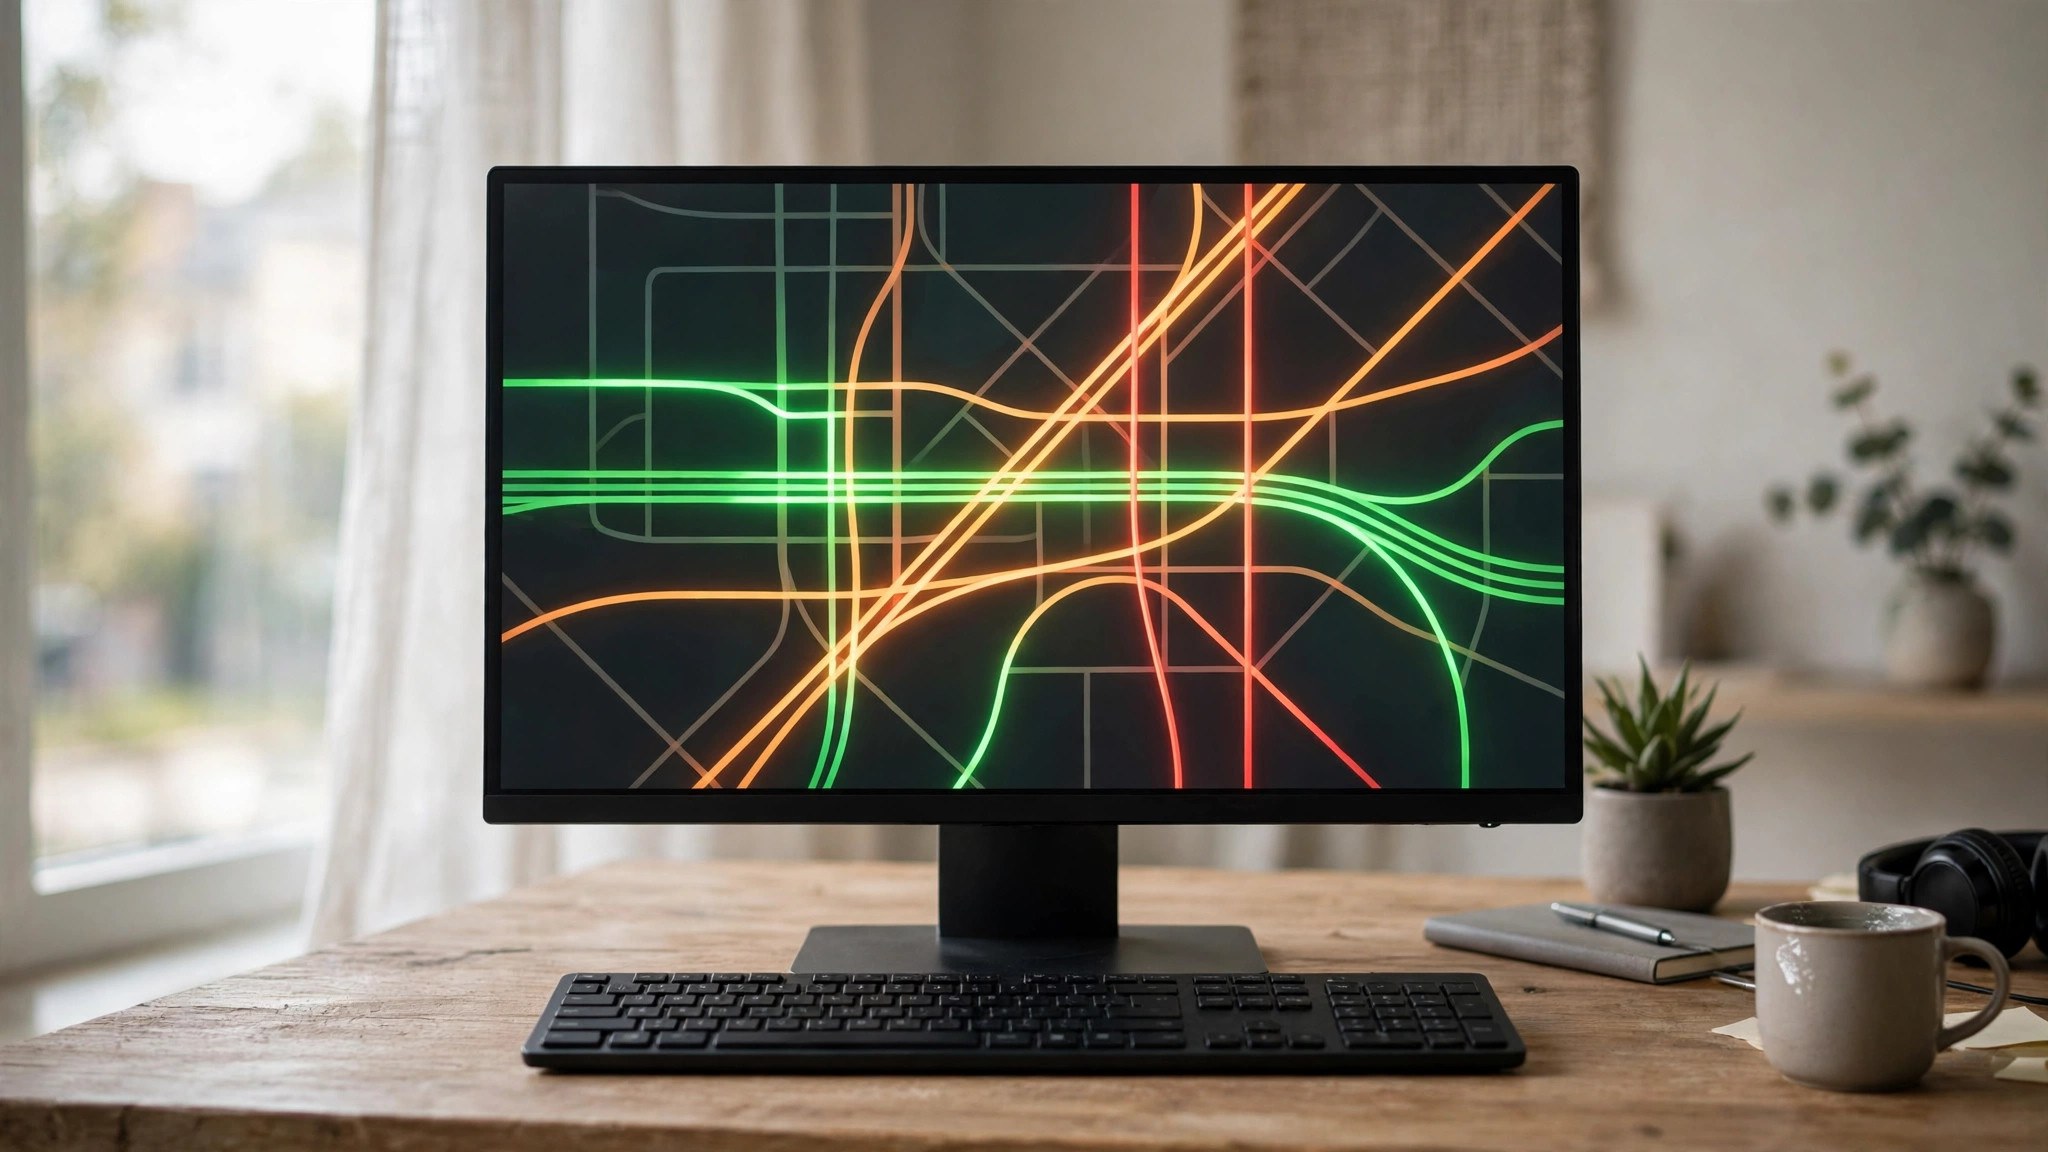
The Google traffic map is what the main map becomes when you enable the traffic layer. Roads with data take on colours; incidents appear as icons; your navigation route incorporates the same feed. Everything else — place labels, popular times, the busy-area labels for districts — stays available alongside it.
To open it on your phone: launch Google Maps, tap the Layers icon (the stacked diamond at the top right of the map), and select Traffic under map details. On desktop at maps.google.com, hover over Layers at the bottom left, click More, and tick Traffic. Google documents these controls in its Maps Help page on layers. The setting is sticky for the session in most versions, so one tap in the morning covers the day’s checks.
traffic google maps
Reading traffic on Google Maps is a skill with three levels. At the first level, you read your route: is it green, orange or red, and what does the ETA say? At the second, you read the alternatives: Maps shows grey comparison routes with their own delays, and the colours on parallel corridors tell you whether a detour is real or just a different jam.
At the third level, you read the city. Zoomed out at rush hour, the map shows the whole congestion system — which radial roads clog first, where the ring road holds up, which river crossing is today’s bottleneck. Dispatchers, delivery riders and cab drivers live at this level; a thirty-second zoomed-out look before leaving tells them things a single-route ETA never could. Our guide to traffic near me is built around this zoomed-out habit.
google maps with traffic
Google Maps with traffic switched on behaves differently from the bare map in a few ways worth knowing:
- ETAs become live. Every directions result is calculated against current conditions and recalculated as they change.
- Rerouting becomes active. Navigation watches parallel routes and proposes a switch when one genuinely saves time.
- Incidents become visible. Crash, roadwork and closure icons appear on the map, each tappable for detail and age of report.
- Typical traffic appears for planning. With a future departure set, the map swaps live data for the historical pattern for that day and hour.
Without the layer, you still get traffic-aware ETAs in navigation — Google always routes with the data — but you lose the visual picture that lets you make your own calls.
maps with traffic
Maps with traffic overlays are now standard across navigation apps, but the implementations differ in one respect that matters: data depth. Google’s advantage is the sheer number of contributing phones, which is why its colours extend to smaller streets in big cities where rival maps show only highways.
The fair comparison points are these: every serious app shows the four congestion levels; they differ in incident detail, in how far down the road hierarchy the data reaches, and in how quickly a fresh jam registers. In data-rich cities the differences are small; in smaller towns, the map with the most local users wins, and that is usually Google.
What do Google map traffic symbols mean?
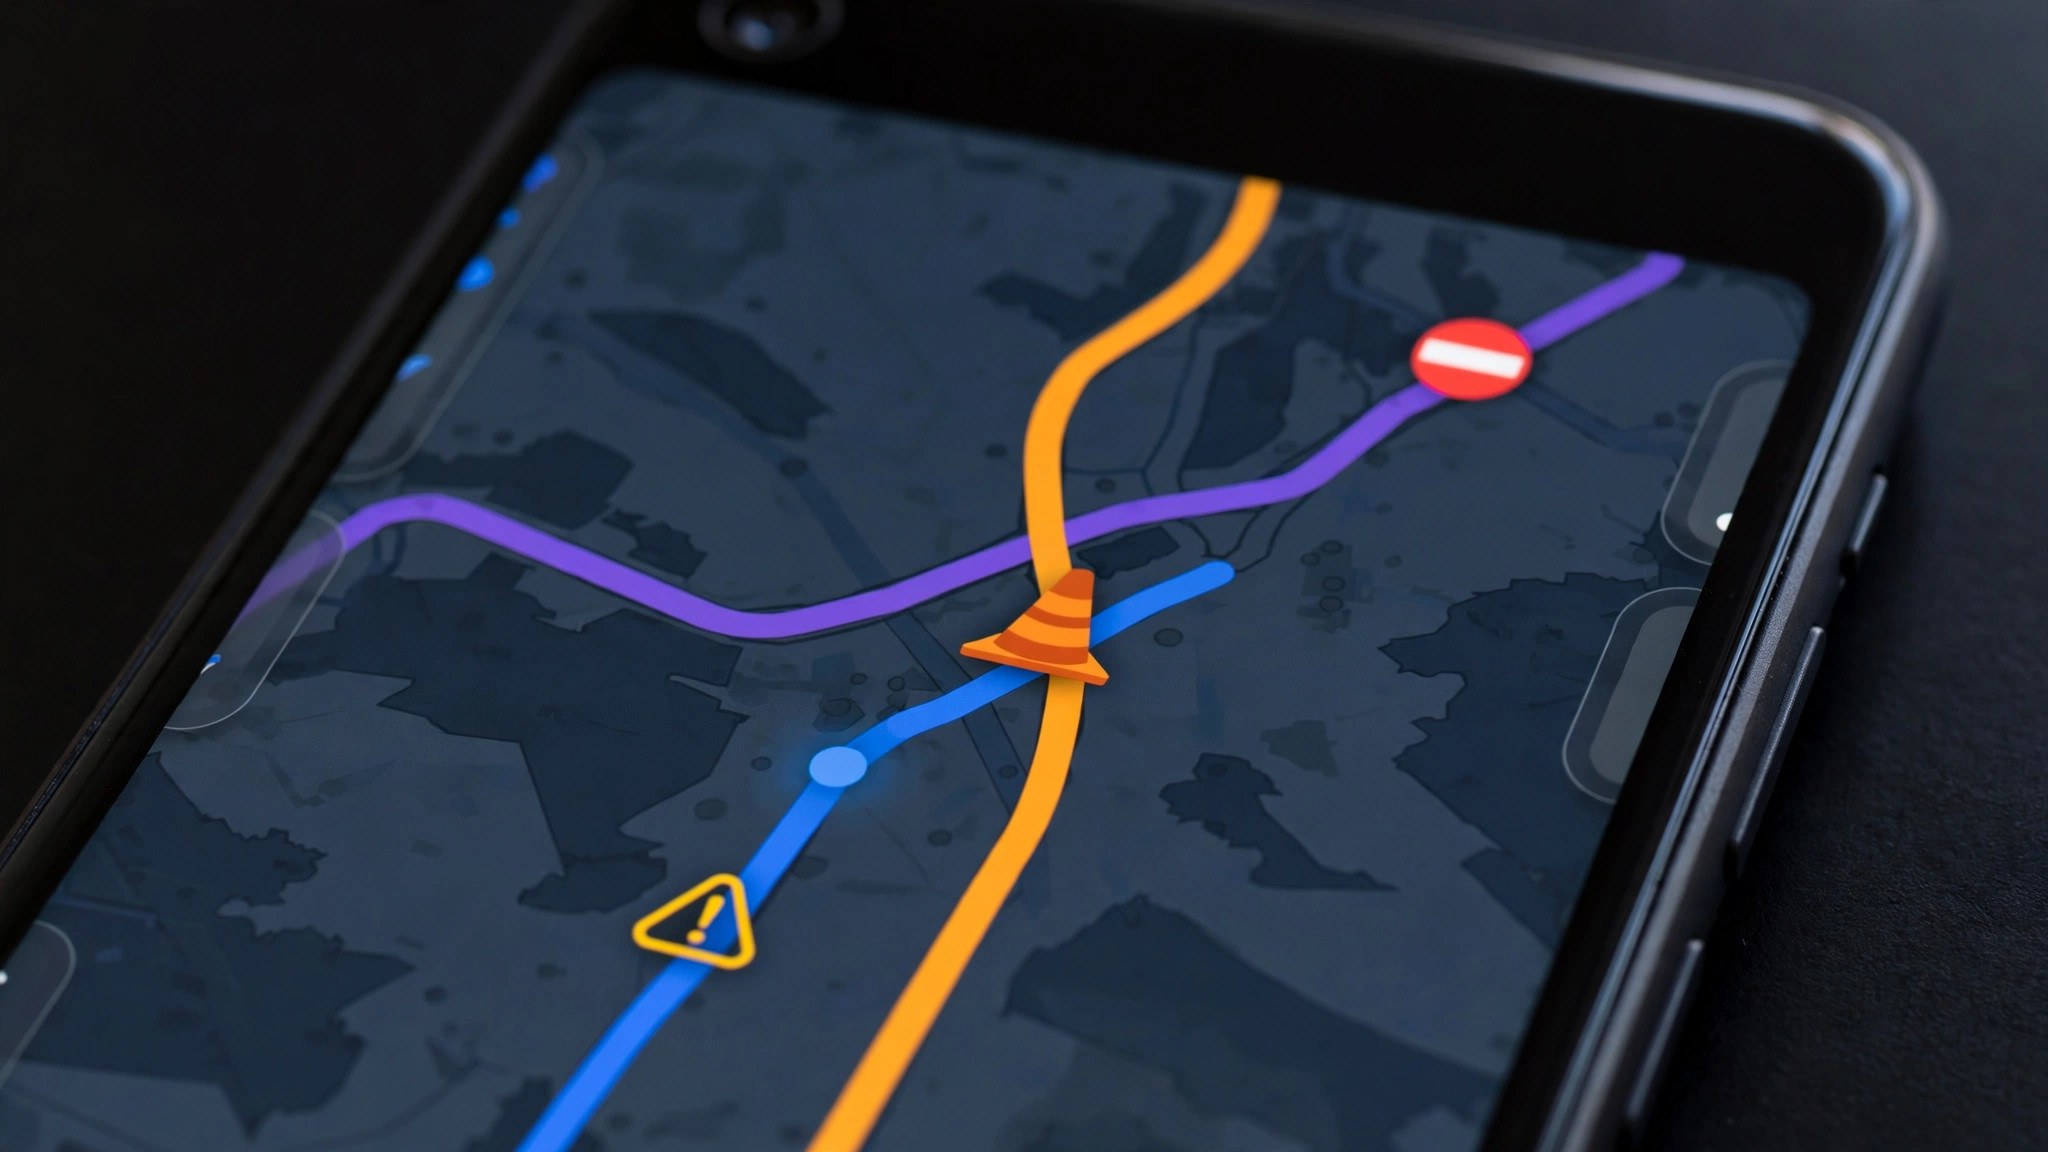
Beyond the colours, the traffic layer carries a small icon language. The set varies slightly by country, but the core symbols are consistent:
- Crash icon — a reported collision; the route summary often adds the estimated delay it causes.
- Roadworks icon — construction or maintenance, frequently with a note if lanes are closed.
- Road closed marker — the road is shut; routing excludes it entirely.
- Stalled vehicle / hazard icon — a breakdown, debris or another reported obstruction.
- Speed camera marker — shown during navigation in regions where Google displays enforcement cameras.
- Congestion shading on your route — during navigation, the blue route line itself turns orange or red on slow stretches, so the symbol is built into your path.
Tap any icon for its detail card: what was reported, how long ago, and in some cases how long the disruption is expected to last. An icon reported two minutes ago describes the present; one reported two hours ago describes history.
How do I know if a road is busy on Google Maps?
You know a road is busy on Google Maps from the combination of three signals, in this order of trust:
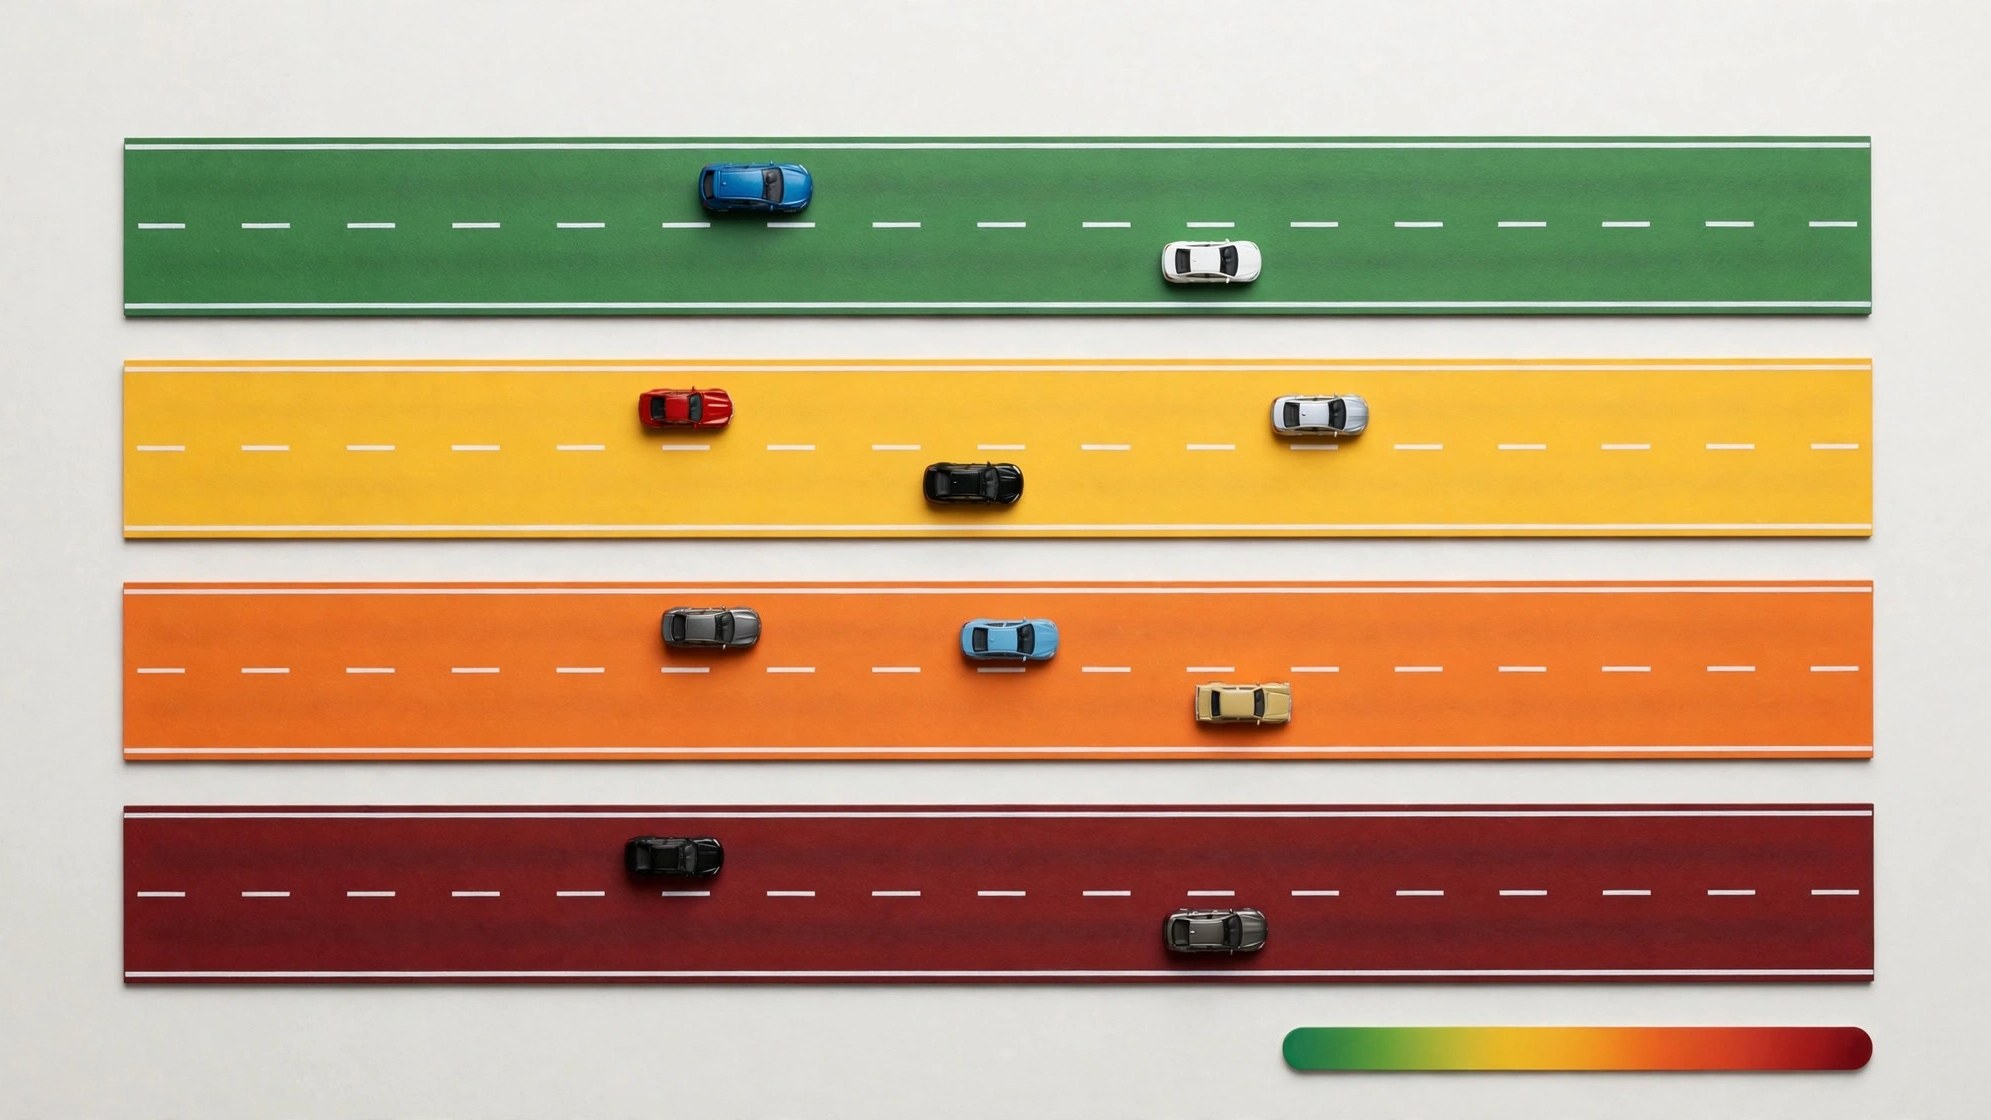
- Its colour. Orange means slowed, red means heavy, dark red means barely moving — each judged against that road’s normal speed, so the colours already account for a road being naturally slow.
- Your ETA through it. Start directions across the road and compare the time with the same journey’s typical time; the gap is the busy-ness in minutes, which is what you actually care about.
- Incident icons on it. A crash or closure on the road explains the colour and hints at how long it will last.
A grey road carries none of these signals — remember that grey means “no data”, not “empty”. On a road Google cannot measure, local knowledge is the only instrument.
How do I check traffic on Google Maps?
The full check takes under a minute once it is a habit:
- Open Google Maps and turn on the Traffic layer.
- Look at your destination’s direction first: which corridors lead there, and what colours do they wear?
- Enter the destination and compare the route options — fastest now, and fastest if you leave in 30 minutes.
- Scan for incident icons on your chosen route; a closure changes the plan more than a jam does.
- If everything is red, consider whether the trip can slide an hour — see our method for checking how’s the traffic for that decision.
That is the entire routine. The feature rewards the two-minute version of you over the zero-minute one almost every single day.
The colours in detail: what each one is really telling you
Because the grading is relative to each road’s own normal speed, the same colour means different absolute speeds in different places — and that is a feature, not a flaw. Green on an expressway means traffic near the speed limit; green on a market lane means traffic moving at that lane’s usual walking-plus pace. The colour answers the only question that matters: “is this road behaving normally right now?”
Orange deserves the most respect of the four. Green is routine and red is obvious, but orange is the transition — the road has begun to slow, and whether it recovers or collapses into red depends on the next twenty minutes. Drivers who react to orange (leaving earlier, choosing the parallel route while it is still green) routinely beat drivers who wait for red to make the decision for them.
Dark red, finally, usually has a cause: an incident, a closure squeezing traffic, a signal failure, a flooded stretch. When you see dark red, look for the icon that explains it before you reroute — sometimes the queue is two hundred metres long and clears fast, and the “shortcut” around it is longer than the wait.
Rush hour shapes: reading the city’s daily rhythm
Use the layer at the same times for a week and a pattern emerges that no single check reveals. Every city has a congestion fingerprint: the corridors that fill at 8:15 and clear by 10, the bridge that is fine at 5:30 and impossible at 6:15, the market road that is a weekday breeze and a Sunday car park.
Learning your own city’s fingerprint is the real prize of the feature. It turns reactive checking (“is there traffic now?”) into planning knowledge (“this crossing is unusable after 6 on Fridays, full stop”). Fleets and cab drivers build this picture over years of driving; the traffic layer lets you build it in a fortnight of deliberate looking.
Desktop vs app: small but real differences
The desktop map is the better planning surface: the typical-traffic timeline lets you scrub a whole day, the bigger screen makes the city-level read easy, and route options list their delays side by side. The app is the better companion: live rerouting, incident reporting, voice guidance and the driving-mode traffic view all live there.
A sensible division of labour: plan the day’s journeys on desktop in the morning, then let the app adapt them on the road. The data underneath is identical, so nothing is lost in the handover.
Frequently asked questions
Why is my route blue but other roads are red?
Blue is your selected navigation route; the red lines are other roads. During navigation, slow stretches of your own route also shade orange and red so you can see trouble ahead on your path.
How often does the traffic layer update?
Continuously, as new speed reports arrive. Busy roads can re-grade within minutes; quiet roads update more slowly because fewer phones report from them.
Does the traffic layer use a lot of battery or data?
Very little of either. The layer is light vector data, and the location reporting involved is the same background activity your phone already does with location services on.
Why does a road show traffic colours at some zooms but not others?
Google reserves detailed colouring for closer zooms to keep the map readable. Zoom in on the road you care about and its grade will appear if data exists.
Can I see traffic from previous days?
Not as a replay. What you can see is the typical pattern for a past day type — the historical view stands in for any specific yesterday.
The short version
Google Maps traffic is a measurement, a language and a routine. The measurement is live speeds from millions of phones; the language is four colours and a handful of icons; the routine is a one-minute check before you move. Learn the language, keep the routine, and the map stops being a picture of streets and becomes a picture of time.
