
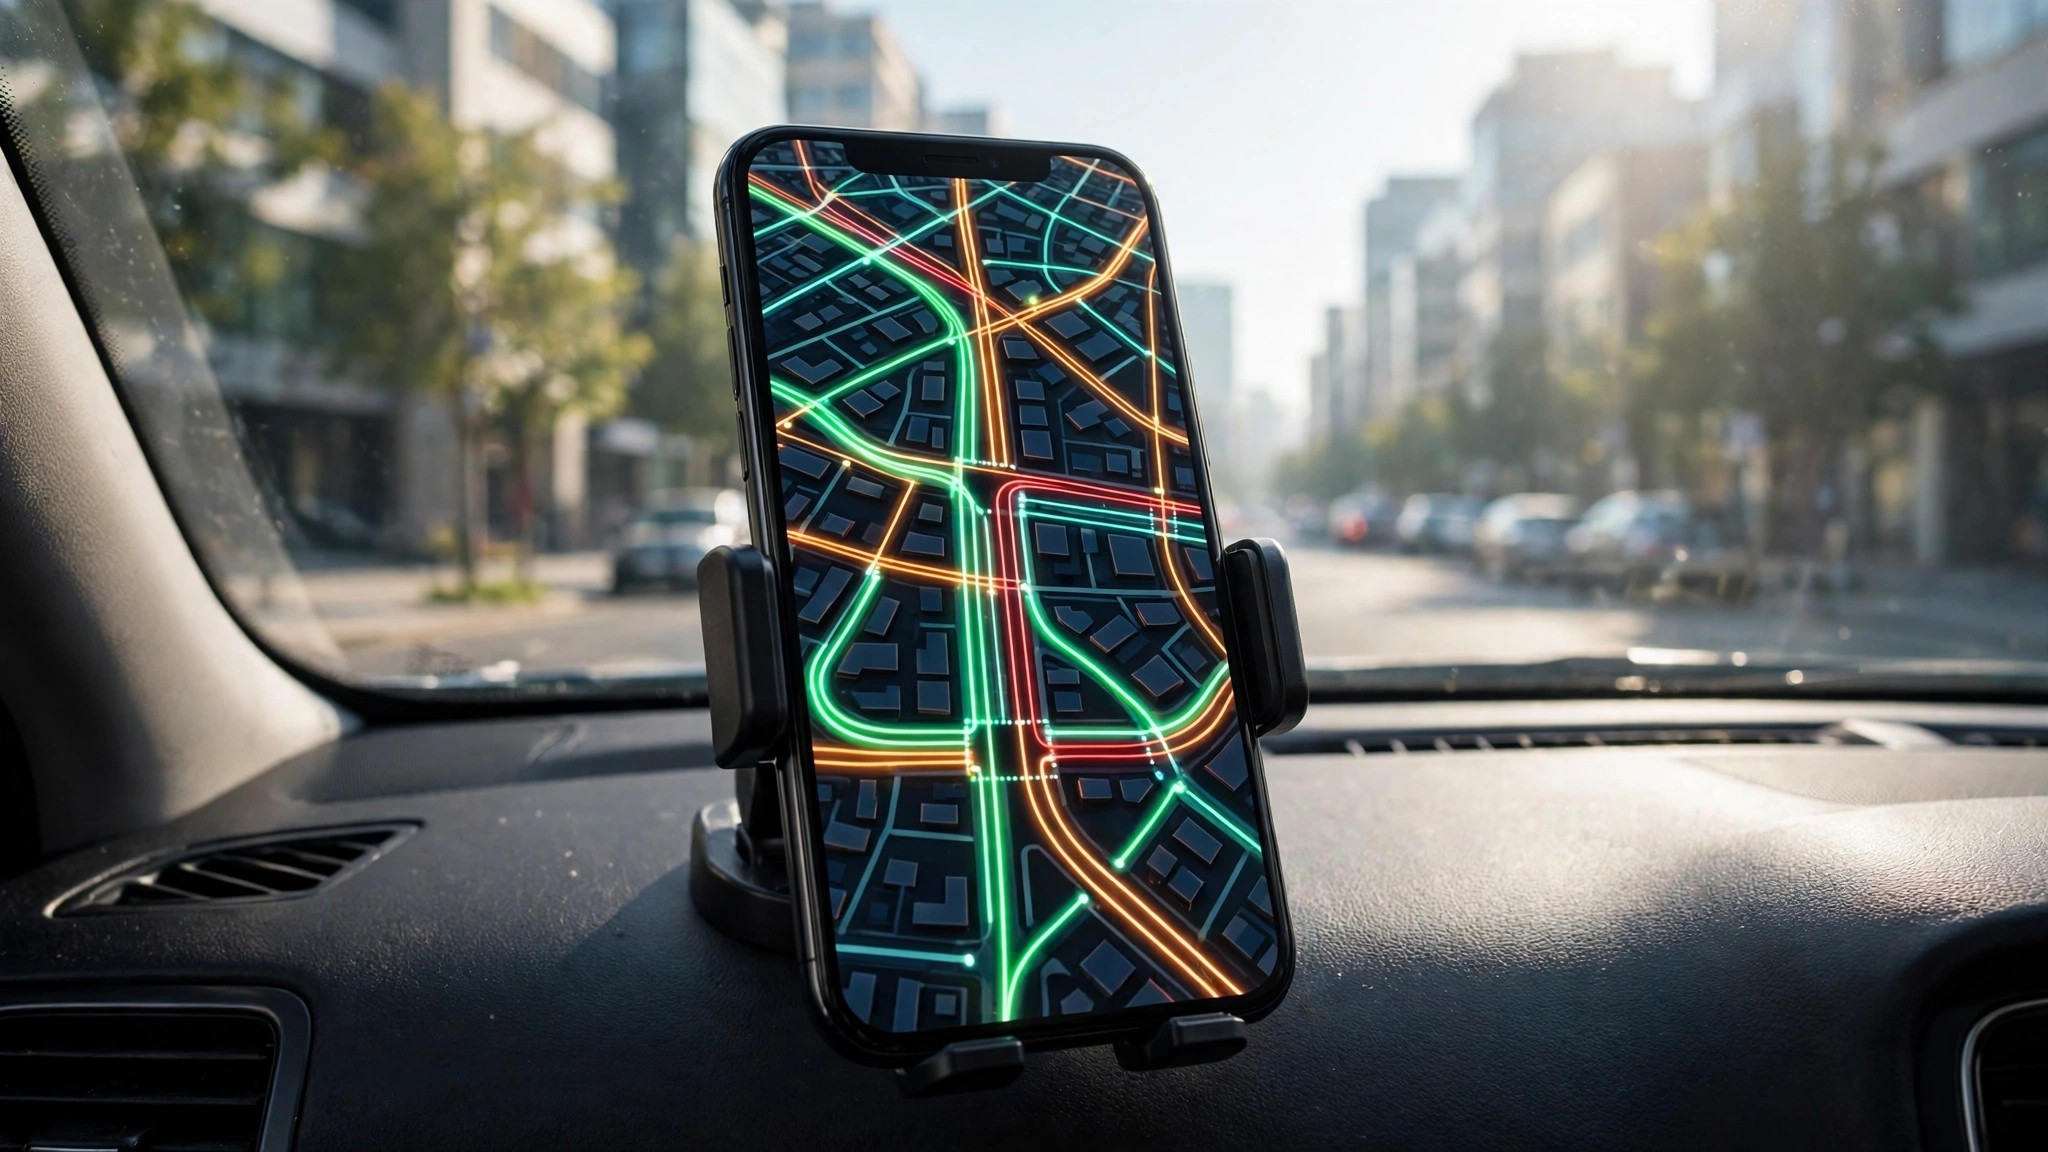
Few things ruin a morning faster than discovering a jam after you are already stuck in it. That is exactly the problem live traffic on Google Maps solves. One tap overlays live traffic conditions on the map, colouring roads from free-flowing green to standstill dark red, so you can see the trouble before it becomes your trouble.
This guide walks through the whole workflow: how to switch the layer on, how to read what it shows, and how to use it alongside your route instead of just glancing at it. If you want the bigger picture first, our pillar guide to busy areas on Google Maps explains how the traffic layer fits with popular times and area busyness.
live traffic map
A live traffic map is simply the normal map with the traffic layer switched on. Instead of plain grey roads, every road with enough data gets a coloured line showing how fast vehicles are actually moving right now. The colours update continuously as conditions change.
The layer works in the Google Maps app on Android and iPhone, and on desktop at maps.google.com. You do not need an account, a subscription, or a special setting — the data is the same live feed Google uses to calculate your arrival times. Where the map stays grey, Google simply does not have enough live data for that road yet, which is common on small rural lanes and brand-new streets.
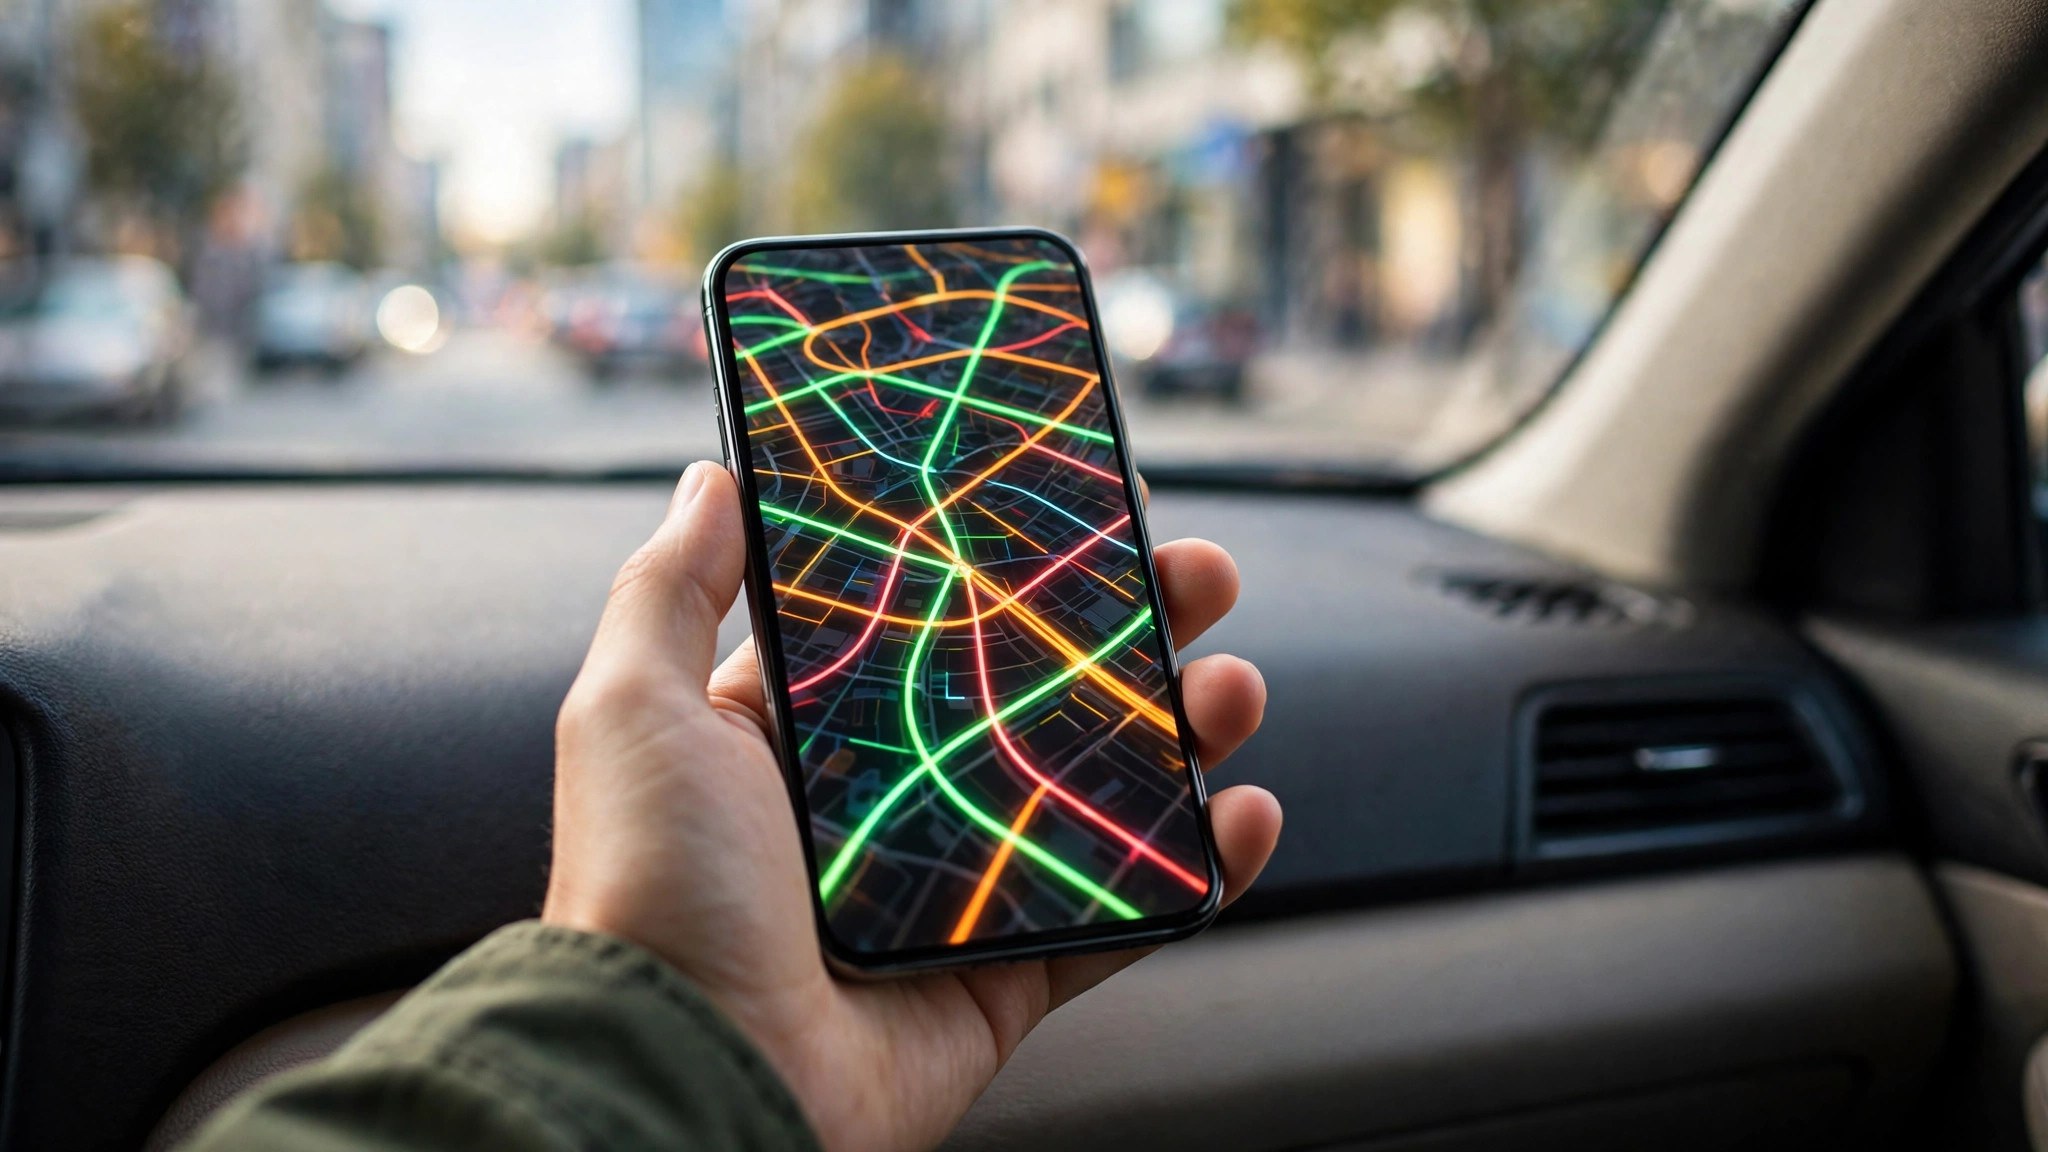
traffic map
People often search for a separate “traffic map” app, but the traffic map they need is already inside Google Maps. The same applies if you are checking traffic near me before a short hop across town — the layer covers local streets as well as highways.
Beyond the coloured roads, the traffic map carries extra symbols worth knowing:
- Incident icons mark reported crashes, roadworks, lane closures and hazards.
- Speed trap and camera markers appear in navigation mode in many regions.
- Closure banners flag roads that are fully shut, with the reason where Google knows it.
- A grey dashed line shows a road with no live data at the moment.
Reading the colours: green is not always “fast”
The four traffic colours grade speed against what that road normally allows, not against a fixed limit:
- Green — traffic is flowing at or near the road’s normal speed. No significant delay.
- Orange — a medium slowdown. Expect speeds noticeably below the free-flow pace, typical of the start of rush hour.
- Red — heavy congestion. Traffic is crawling, and the darker the red, the slower it gets.
- Dark red (maroon) — near standstill. This is the colour of accident queues and gridlocked junctions.
Because the grading is relative, an orange main road in central Mumbai at 7 p.m. may still move faster than a green rural lane. Read the colour together with the ETA: if Maps says your 20-minute route is now 45 minutes, the colours on that route are telling the truth even where they look mild.
Zoom matters too. Zoomed far out, only major highways show colours; zoom in and the layer grades smaller arterials and, in dense cities, even significant local streets. If a road you care about looks grey, zoom closer before concluding there is no data.
Live traffic vs typical traffic: two different tools
Live traffic answers “what is happening on the roads right now?” Typical traffic answers “what usually happens at this hour on this day?” Both live in the same feature, and confusing them causes real planning mistakes.
Live traffic is the layer described above — real-time, reactive, and the right tool for a journey starting in the next few minutes. Typical traffic appears when you set a future departure time for directions, or browse the desktop layer for a chosen day and hour. It is built from historical patterns: the school-run peak that forms every weekday at 8:30, the market street that clogs every Sunday afternoon.
Use live traffic for today’s drive and typical traffic for planning tomorrow’s. A road that is green right now at 2 p.m. can be reliably red at 6 p.m., and only the typical view will warn you.
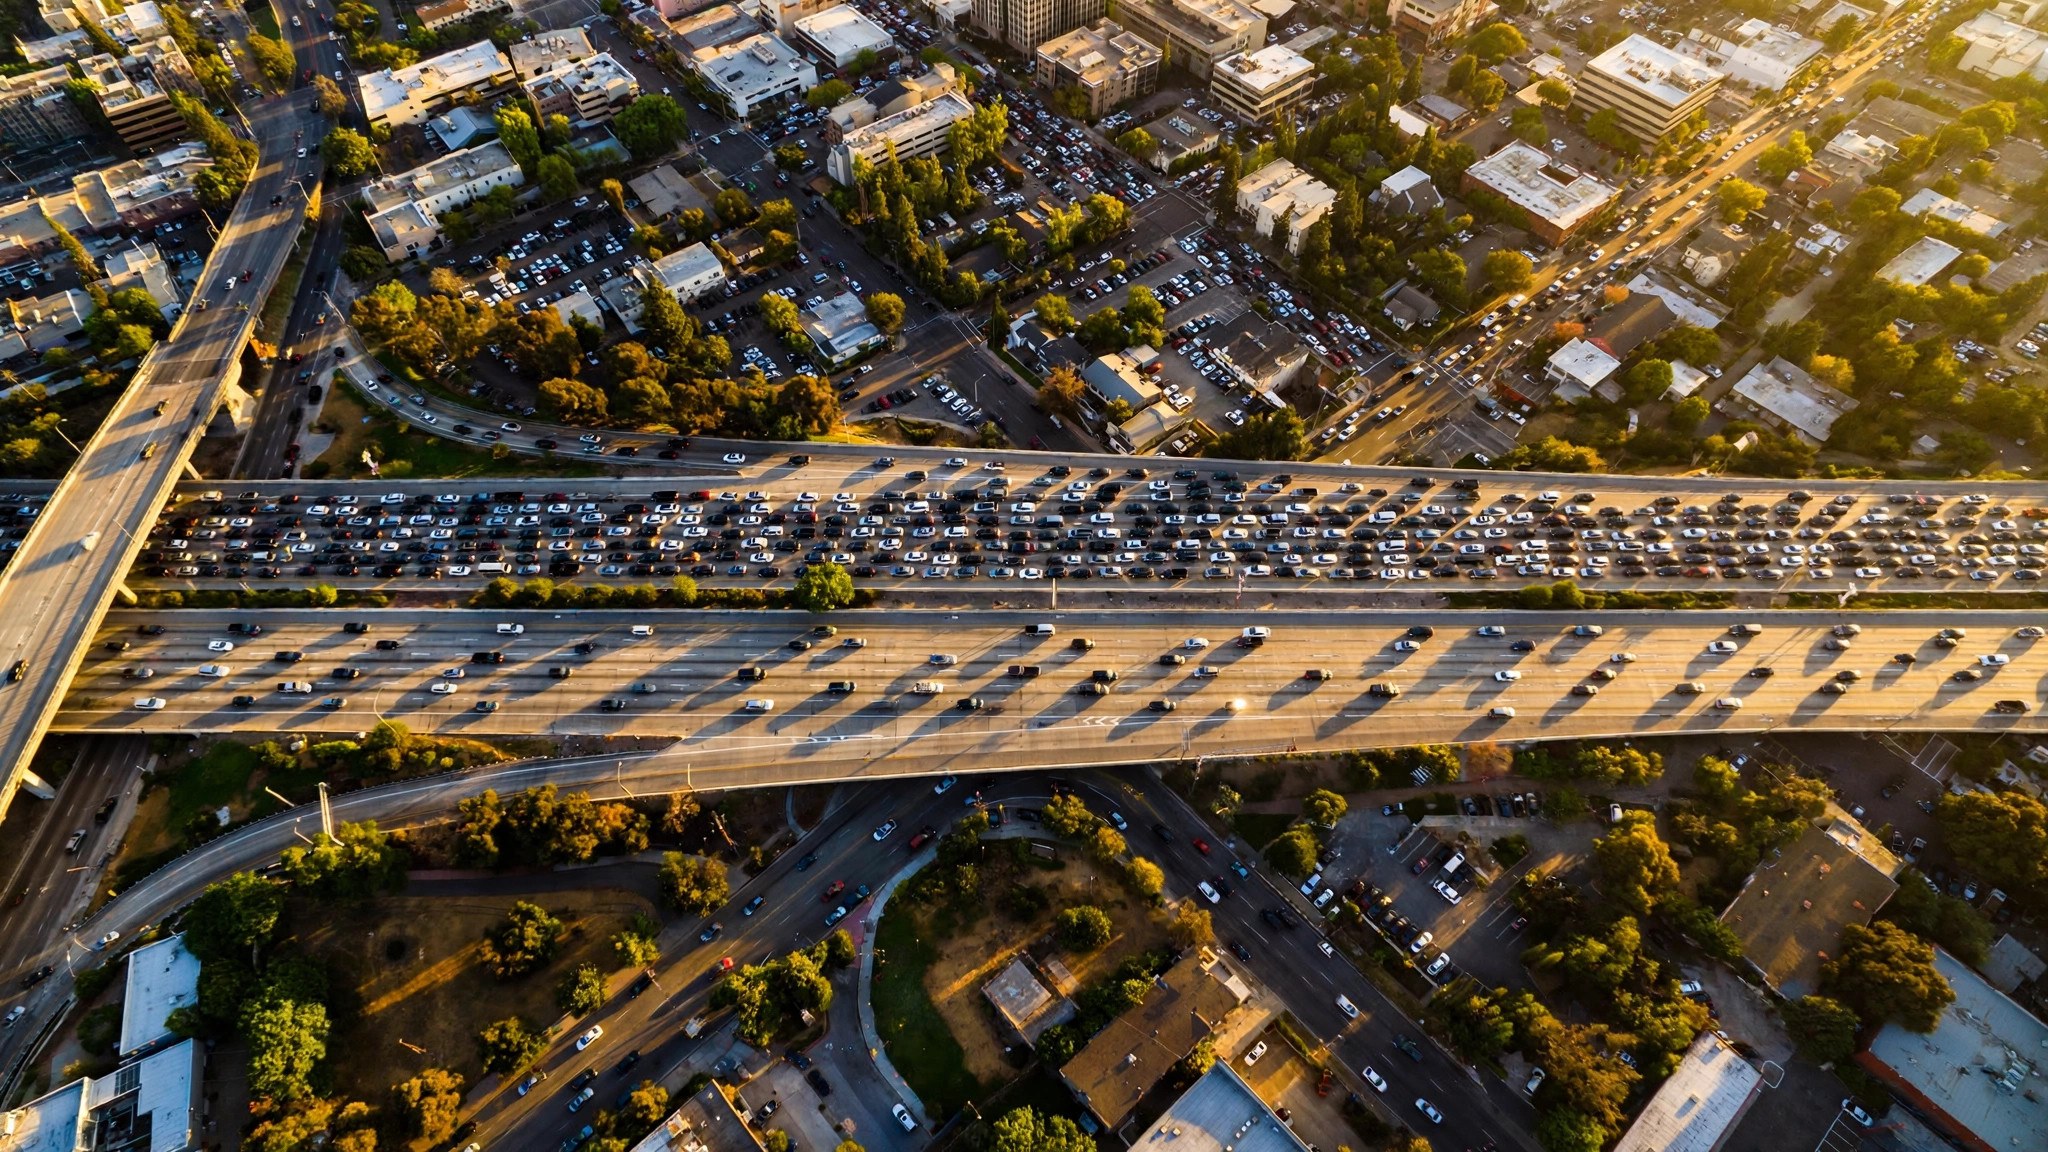
how to check live traffic on google maps
Checking takes under ten seconds once you know where the toggle lives:
- Open Google Maps on your phone or at maps.google.com.
- Tap or click the Layers icon — the diamond-shaped stack near the top right of the map.
- Under “Map details”, choose Traffic.
- Roads with live data immediately change colour. Tap the option again to switch it off.
On desktop, the same option sits in the Layers panel at the bottom left: hover over it, click More, then select Traffic. Google’s own Maps Help page on layers documents the same steps for every platform.
how to get live traffic on google maps
If the traffic option is missing or the roads stay grey, work through these basics before assuming the feature is broken:
- Update the app. Very old versions of Google Maps hide or rename the Layers menu.
- Check you are zoomed in. At country-level zoom the traffic colours fade out; zoom to city level or closer.
- Confirm your connection. Live traffic needs mobile data or Wi-Fi; offline maps show no live layer.
- Pick a covered area. Traffic data exists for most cities and major roads worldwide, but not for every minor street.
Once those are in place, live traffic should appear automatically whenever you open the layer.
how to see live traffic in google maps
There is a second way to see live traffic in Google Maps that many drivers prefer: inside navigation itself. Start directions to any destination and your route is drawn with live conditions baked in — the blue route line changes colour where traffic slows, and grey alternative routes show their own delays for comparison.
Navigation mode adds two things the plain layer does not. First, the arrival time continuously recalculates against live conditions, so a worsening jam pushes your ETA back in real time. Second, Maps will actively suggest a faster alternative mid-journey when one opens up, with the time saving stated before you accept.
how to see live traffic on google maps
To see live traffic on Google Maps for a specific journey later today, use the desktop “typical traffic” view or the app’s departure-time setting. Set directions, choose “Depart at” for your planned time, and Maps blends live patterns with historical data for that day and hour.
This is the same trick behind checking how’s the traffic before you leave: a five-minute look at the map at breakfast can tell you whether the 9 a.m. school-run peak or the 6 p.m. office exodus is the better window for your trip.
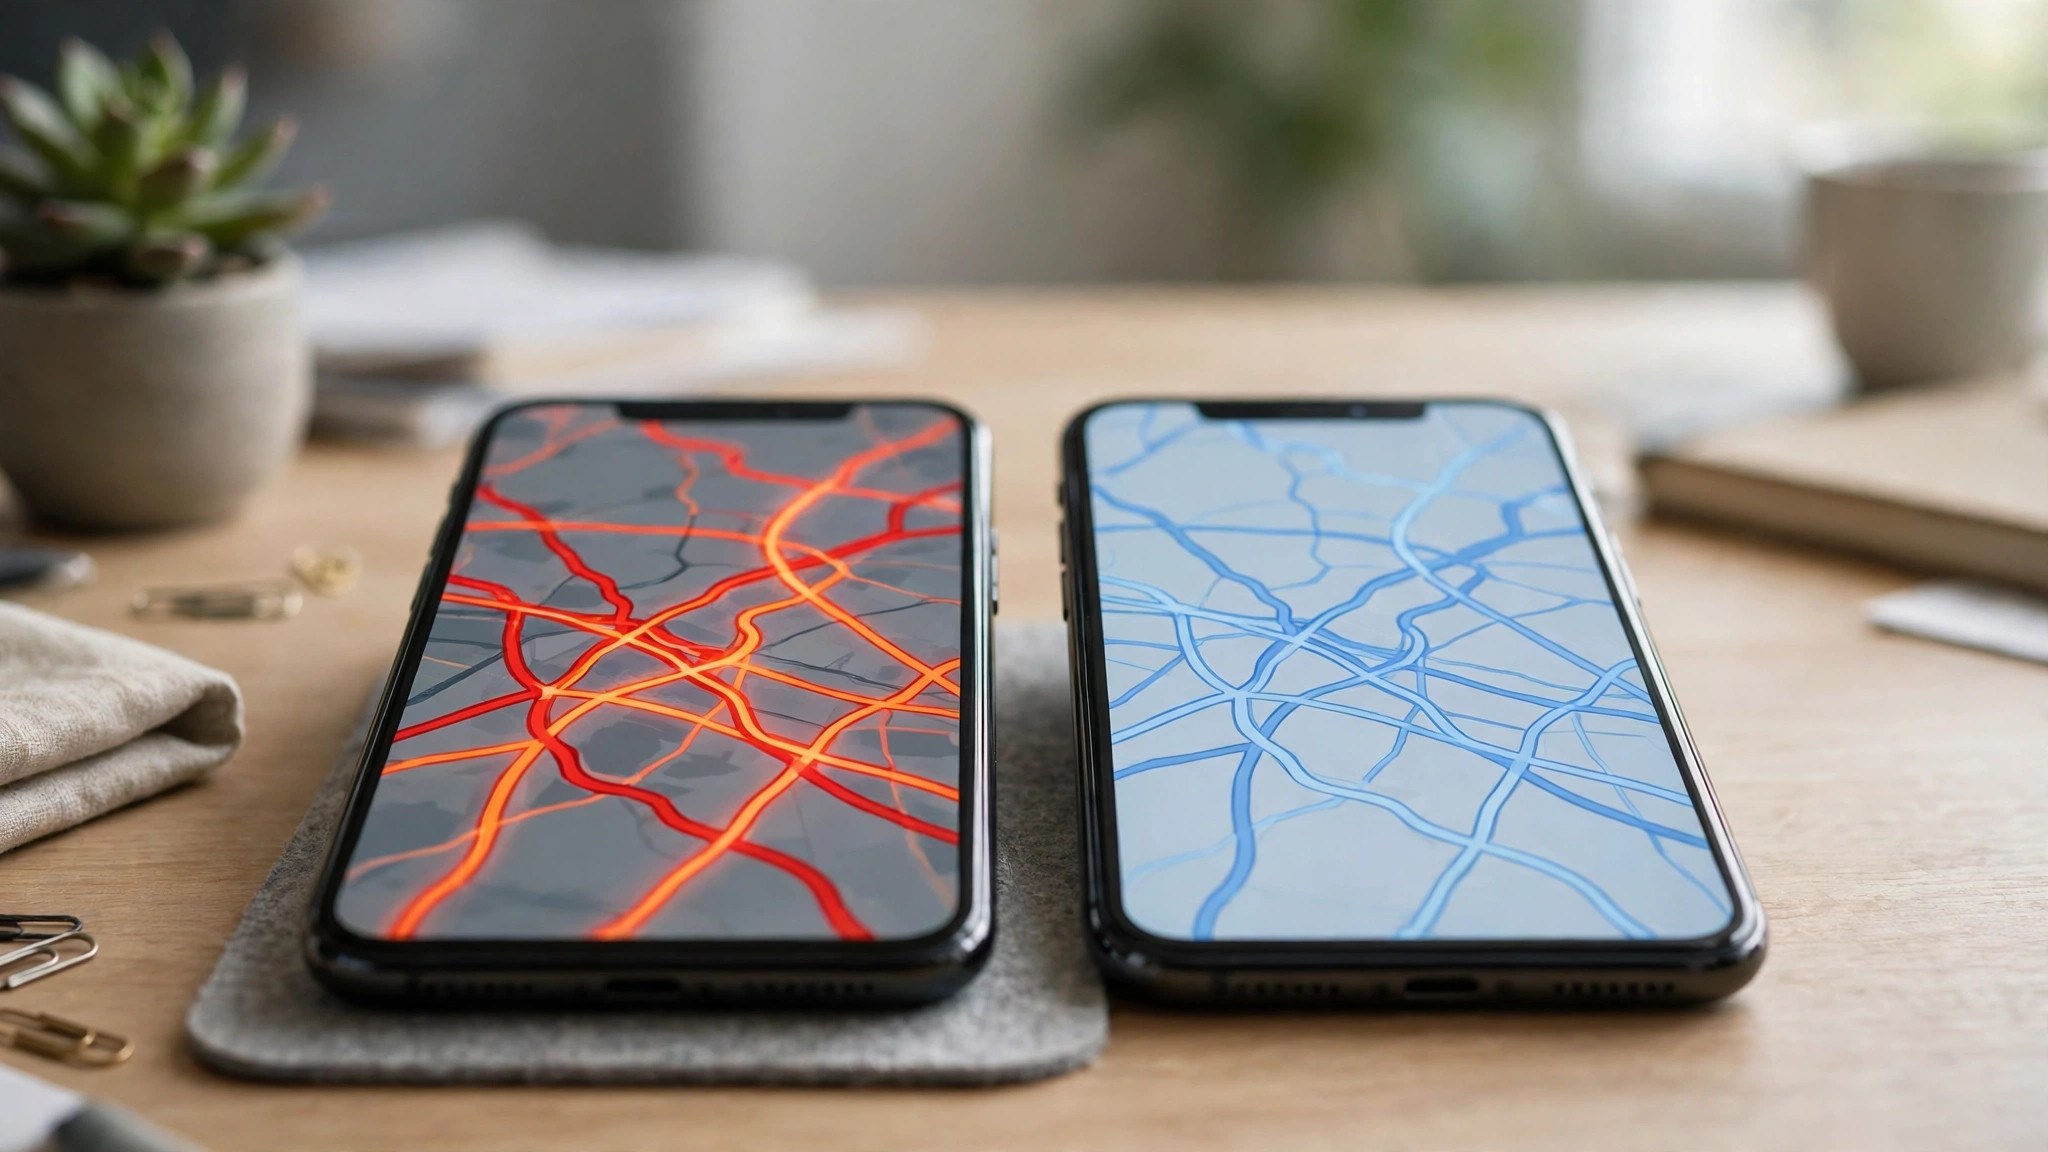
see live traffic google maps
When you see live traffic, Google Maps is showing you an aggregate, not a camera feed. The colours come from anonymised movement data from phones travelling on those roads, combined with road sensors and official reports in many countries. If phones on a stretch of road slow from 60 km/h to 15 km/h, the line turns orange, then red.
That is also why the picture is “live” rather than instant to the second: Google needs enough vehicles reporting from a segment before it can grade it confidently. On a busy highway that takes moments; on a quiet road at 3 a.m., the colour may lag or never appear.
show live traffic on google maps
Want Maps to show live traffic on Google Maps every time you open it? A few habits make the layer feel always-on:
- Commute settings: Add your home and work addresses and set commute times; Maps then surfaces traffic for that route on your home screen.
- Driving mode and widgets: The Android driving shortcut and the traffic widget show nearby conditions without opening the full app.
- Saved routes: Pin a frequent route and its live status is one tap away.
None of these change the underlying data — they just remove the two taps between you and the traffic picture.
Live traffic in Indian cities: what to expect
India is one of the strongest markets for this feature because phone density on the roads is so high. In metros like Delhi, Mumbai, Bengaluru, Hyderabad and Chennai, the layer grades not just highways and ring roads but many inner arterials, and the colours track the twin commute peaks — roughly 8:30–10:30 a.m. and 6–9 p.m. — closely.
A few India-specific patterns the layer reveals well:
- Metro construction corridors show persistent orange through the working day, not just at peak hours.
- Festival and match days light up roads around venues hours before the event starts — the live layer often shows the surge before news reports mention it.
- Monsoon waterlogging appears as sudden red patches on underpasses and low-lying stretches during heavy rain, contributed by drivers reporting hazards in the app.
The limitation is the mirror image: on smaller-town roads and state highways with few phones reporting, stretches stay grey even when a local jam exists. Treat a grey road there as “unknown”, and lean on typical traffic patterns plus local knowledge.
Frequently asked questions
Why do some roads have no colour at all?
Google grades a road only when enough vehicles with location sharing are travelling on it. Quiet streets, very new roads and remote areas often stay grey, which means “no data”, not “no traffic”.
Is live traffic the same as the ETA in directions?
They are two views of the same data. The layer shows conditions; the ETA uses those conditions, plus historical patterns, to estimate your journey time.
Does checking live traffic use much data?
Very little. The layer is lightweight vector information, far lighter than satellite view. It works comfortably on a modest mobile connection.
Does live traffic work for walking or cycling routes?
Not in the same way. The layer grades motor traffic for drivers. Cyclists get their own layer showing bike-friendly roads, and walking directions ignore road congestion — though a severely jammed area is still a hint that crossings and pavements nearby will feel crowded too.
Why does the colour sometimes change while I watch?
Because the feed is genuinely live. As more phones report from a segment, or a queue clears, Google re-grades the road. Around the start and end of rush hour, colours can shift within minutes.
Can I see traffic for a different city?
Yes. Pan the map anywhere, keep the traffic layer on, and covered roads there will show their live colours — handy before a trip to another city.
The short version
Live traffic turns Google Maps from a street atlas into a live conditions board. Switch the layer on through the Layers icon, read green as go and red as avoid, and let navigation mode watch the picture for you while you drive. Two taps before you leave is the cheapest travel insurance there is.
