
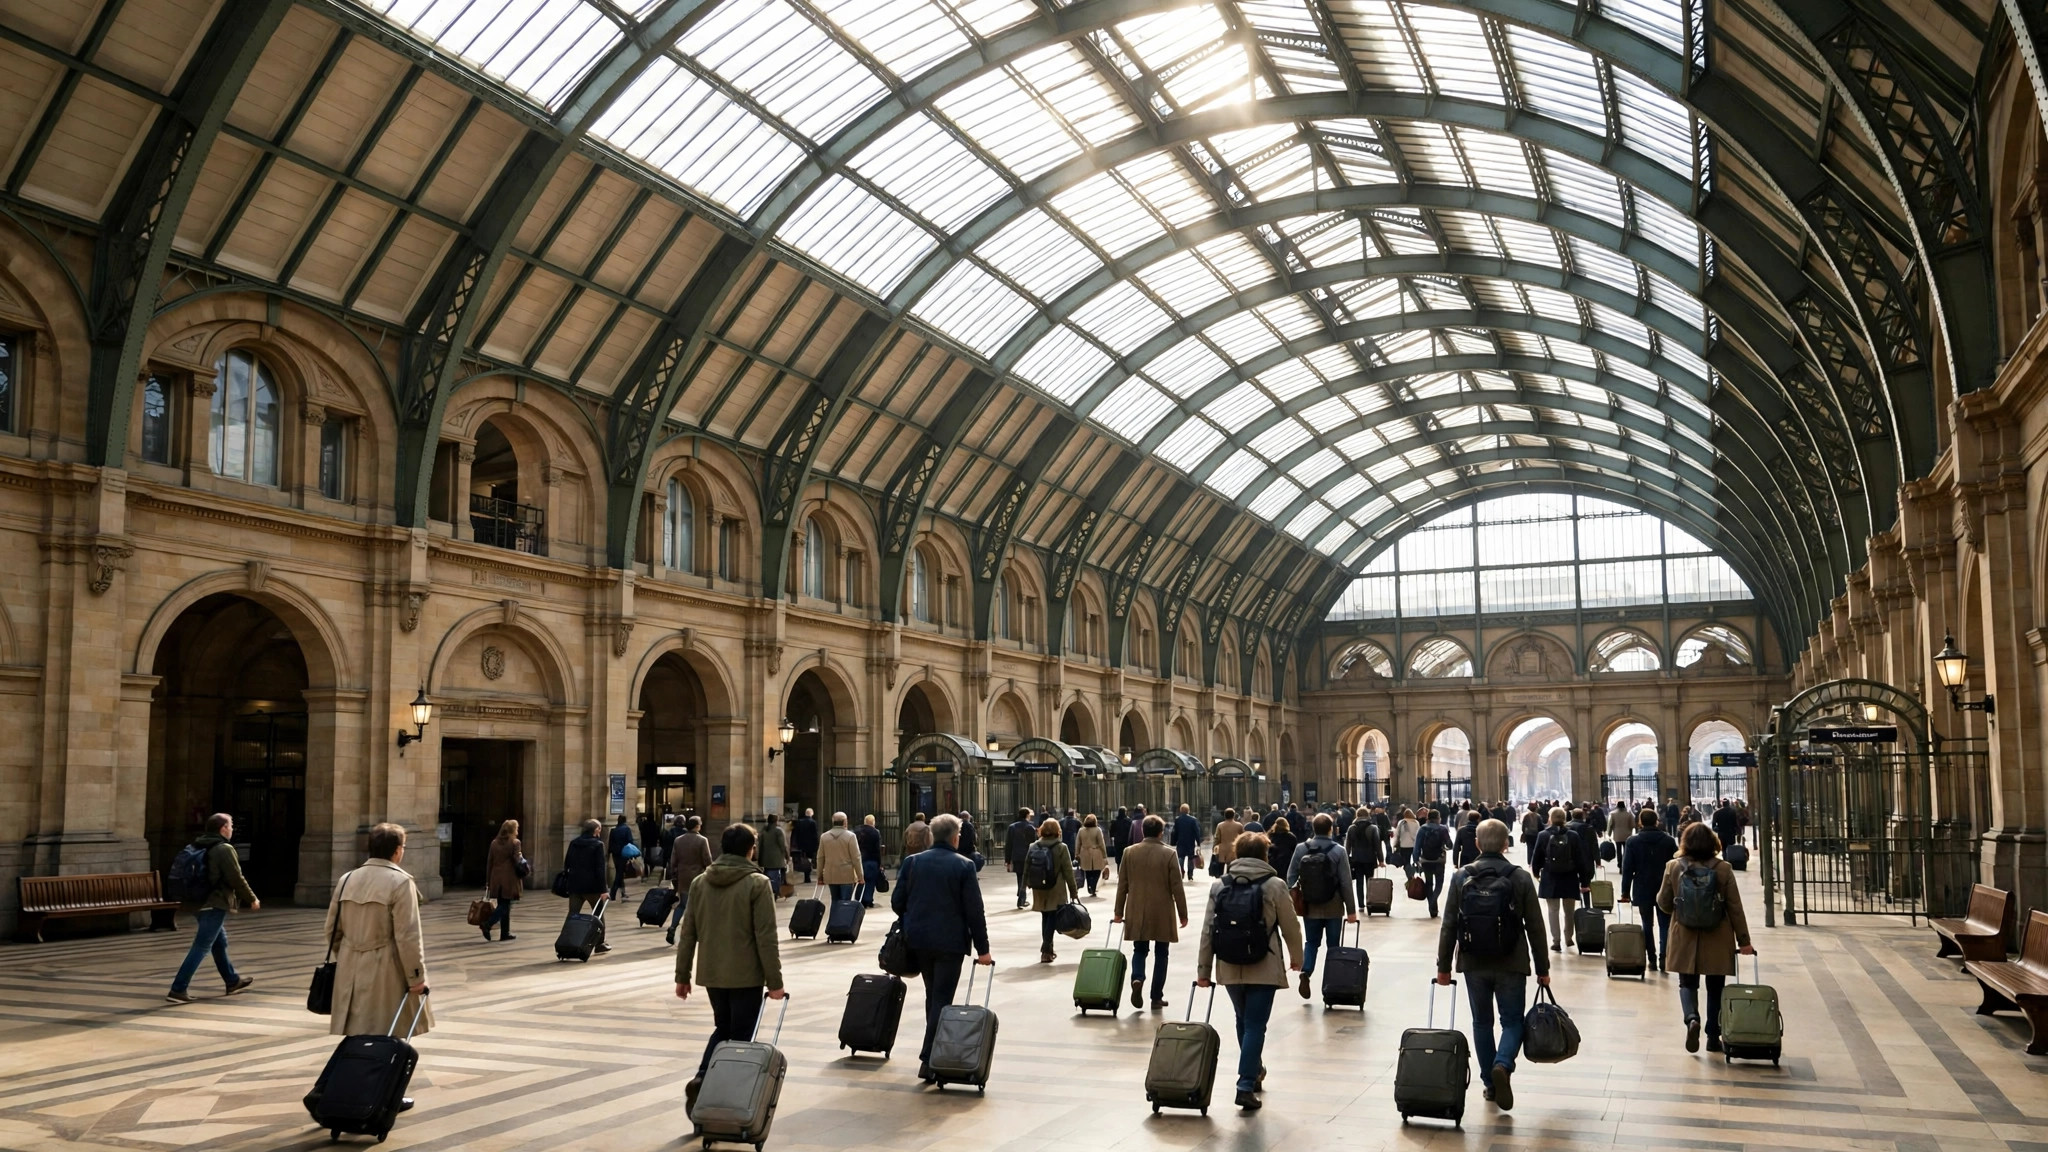
A large modern place is rarely one place. A mall has four entrances and forty pressure points; a hospital is an OPD, a pharmacy, a diagnostic wing and an emergency door sharing one name; a big-box store runs a showroom, a billing floor and a service counter on different clocks. Yet Google Maps gives most of them a single listing and a single Popular Times graph. Reading that graph well means knowing which of the place’s several crowds it is describing — and which ones it is quietly averaging away.
This guide is about reading popular times for multi-entrance locations: how their single graph is built, how to decompose it with the help of sub-listings and department data where they exist, and how to plan a multi-part visit — park, consult, pharmacy, billing — against a crowd that is really four crowds wearing one label. It extends our main explainer on Google Maps Popular Times to the locations that feature explains least obviously.
One listing, many crowds: how popular times for multi-entrance locations are built
The graph aggregates visits to the place’s footprint as a whole. Every measured visit inside the boundary — whichever door the visitor used, whichever department they came for — pools into the same hourly pattern. The result is a blended rhythm: the hospital’s graph peaks mid-morning because the OPD does, even though its pharmacy peaks at discharge hours and its emergency door knows no peak at all.
Blending has a virtue and a cost. The virtue is simplicity and statistical strength: pooled visits cross the data threshold easily, so big composite places almost always have rich graphs when a department alone might not qualify. The cost is resolution: the graph cannot tell you that the east entrance is calm while the west is choked, or that billing is empty while registration is slammed. For places where the parts genuinely move together — a single-hall supermarket, a cinema — the blend is honest. For true multi-part institutions, it is a first approximation that the rest of this article teaches you to refine.
The visit duration line blends the same way, and sometimes betrays the blend: a hospital duration of “30 min to 3 hr” is not vagueness but two different visits — the pharmacy sprint and the OPD saga — sharing one statistic.

Finding the sub-listings: departments with graphs of their own
Google’s map data often contains the parts as places in their own right. Search inside the composite: the mall’s anchor stores, the hospital’s named clinics, the station’s specific terminals, the university’s library — many carry their own listings, and the busier ones carry their own graphs. This is the single most useful refinement available, and it costs one extra search.
The pattern of results teaches you the institution’s internal geography. Where a department has its own graph, use it for that leg of your visit and demote the parent graph to a parking-and-arrival forecast. Where a department has a listing but no graph, its visitors are being counted in the parent’s pool — the parent’s peak is partly its doing, and arriving against the parent’s valley still helps. Where no sub-listing exists at all, the parent graph is the only instrument, and the decomposition tricks in the next section are your refinement.
Stations are the showcase case. A major Indian railway terminus may present as one listing with fearsome twin commuter peaks, while its metro interchange, its reservation centre and its individual platform zones behave quite differently — the reason our area guide to the Indian railway station area treats the station quarter as several overlapping places rather than one.
Reading one graph as several: decomposition tricks
When only the blended graph exists, read it like a chord — several notes sounding together — and separate the notes by their known schedules:
- Peaks that align with office or school hours usually belong to the service counters: registration, admissions, billing, customer care. These crowds are appointment- and token-driven and collapse sharply outside their windows.
- Peaks that align with meal hours belong to the food parts: the hospital canteen, the mall food court, the station refreshment rooms. They are tall, narrow and predictable to the quarter hour.
- Peaks that align with arrivals and departures — trains, flights, OPD discharge rounds, cinema showtimes — belong to the flow machinery: entrances, security, parking, pick-up zones. They spike and drain fast.
- The long plateau underneath everything is the place’s ambient crowd: shoppers in the mall’s corridors, attendants in the hospital’s wards-side, students on the campus green.
Now aim your visit at the note you actually need. A hospital trip for only the pharmacy should ignore the OPD’s mid-morning mountain and time itself to the pharmacy’s own late-afternoon pattern, which the blended graph shows as a modest shoulder. A mall trip for one anchor store should read that store’s own listing first and the mall’s graph second. The blend never disappears, but it stops ruling you.
Entrances, parking and the geometry of arrival
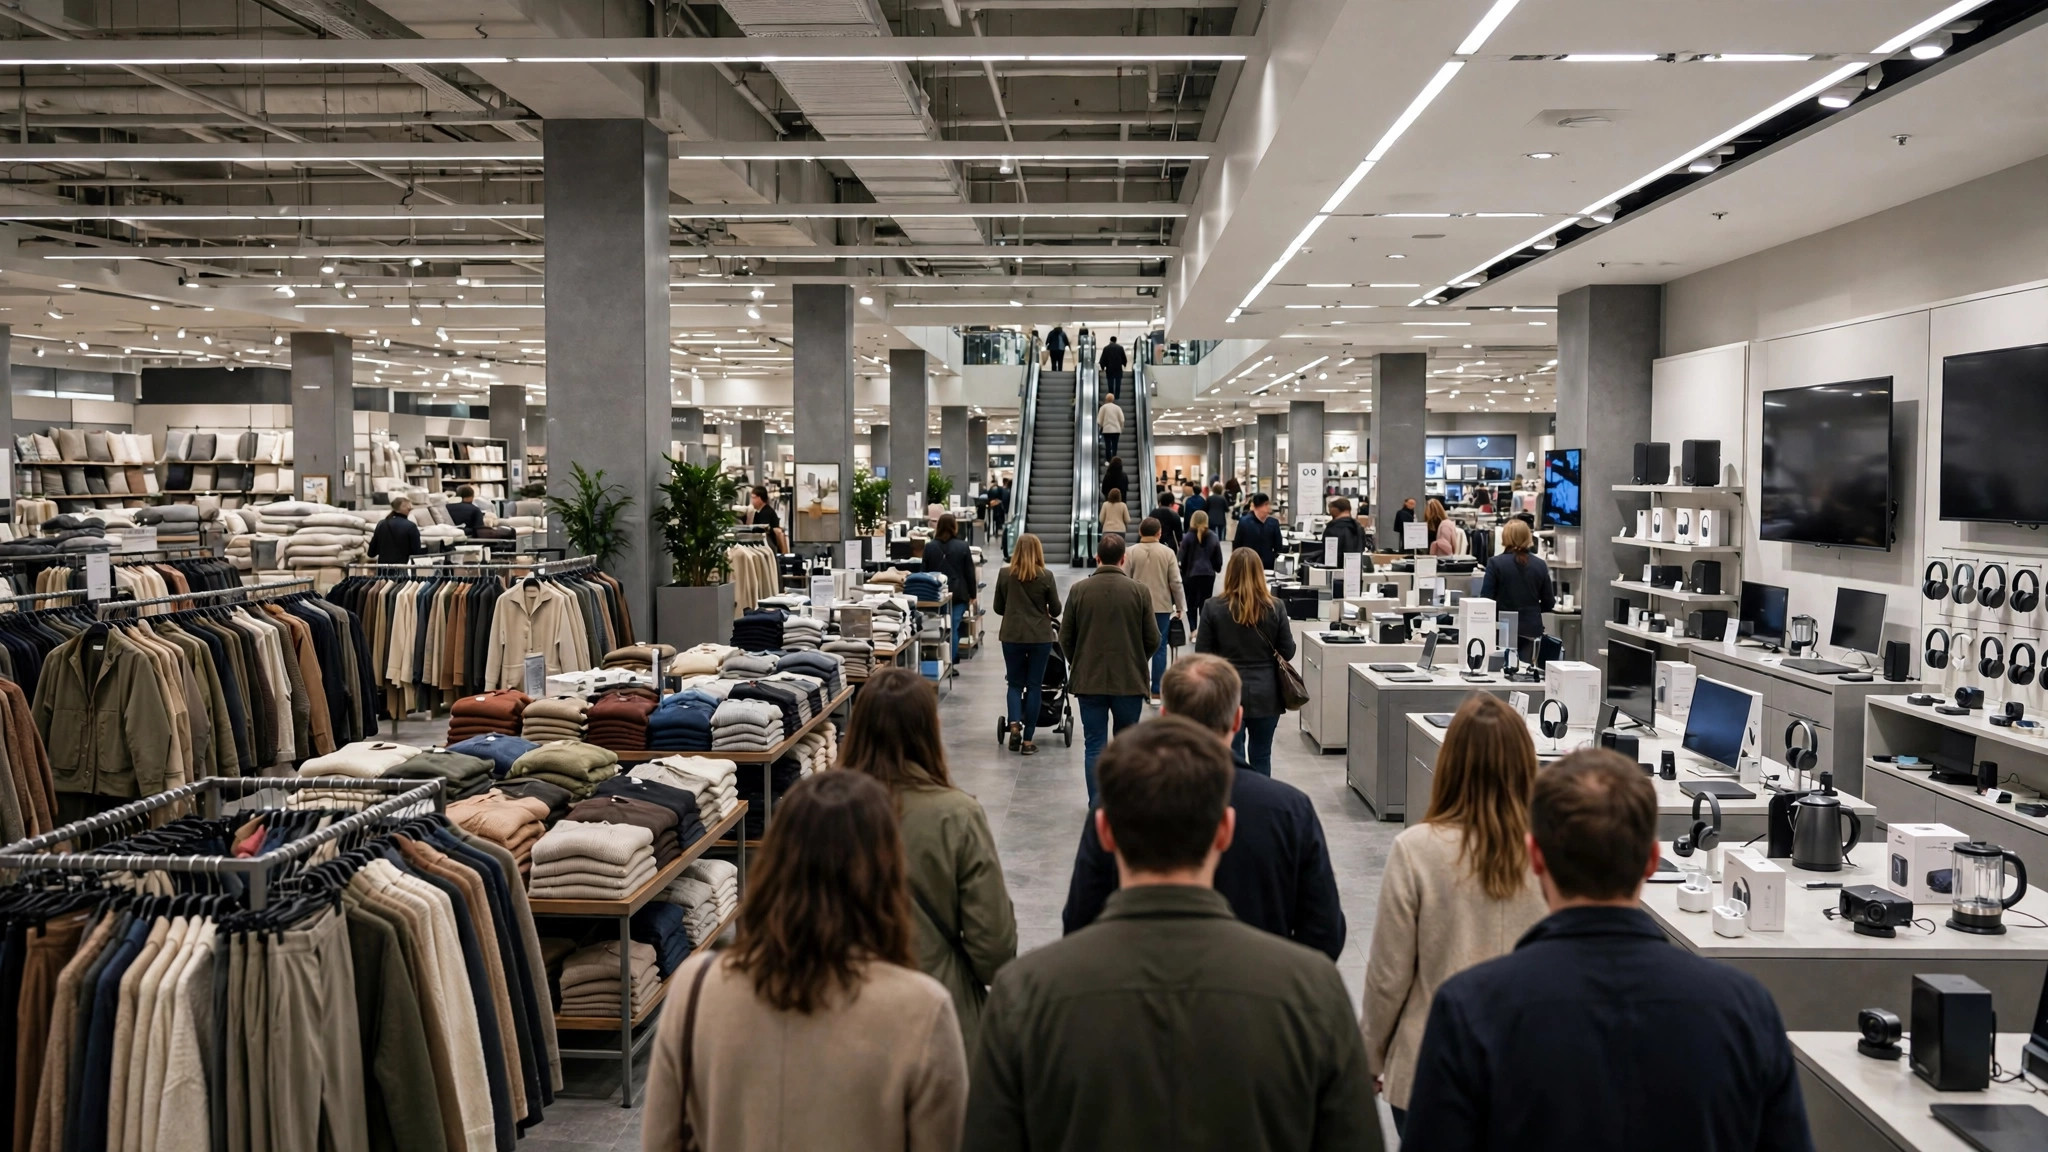
Multi-entrance places add a spatial puzzle the graph cannot draw: which door. Local knowledge fills part of it — regulars know the mall entrance by the metro station is the crushed one, and the hospital gate by the pharmacy is the calm one — but Maps contributes two signals. The live bar, read at departure, tells you the whole place’s present pressure; if it is high, choose the entrance serving your department directly rather than the grand main door, because internal corridors at composite places move crowds between departments slowly. And the reviews of the listing are an unmined atlas: sort by recent, search for “entrance,” “gate,” “parking” and “queue,” and visitors will have mapped the geometry for you in plain words.
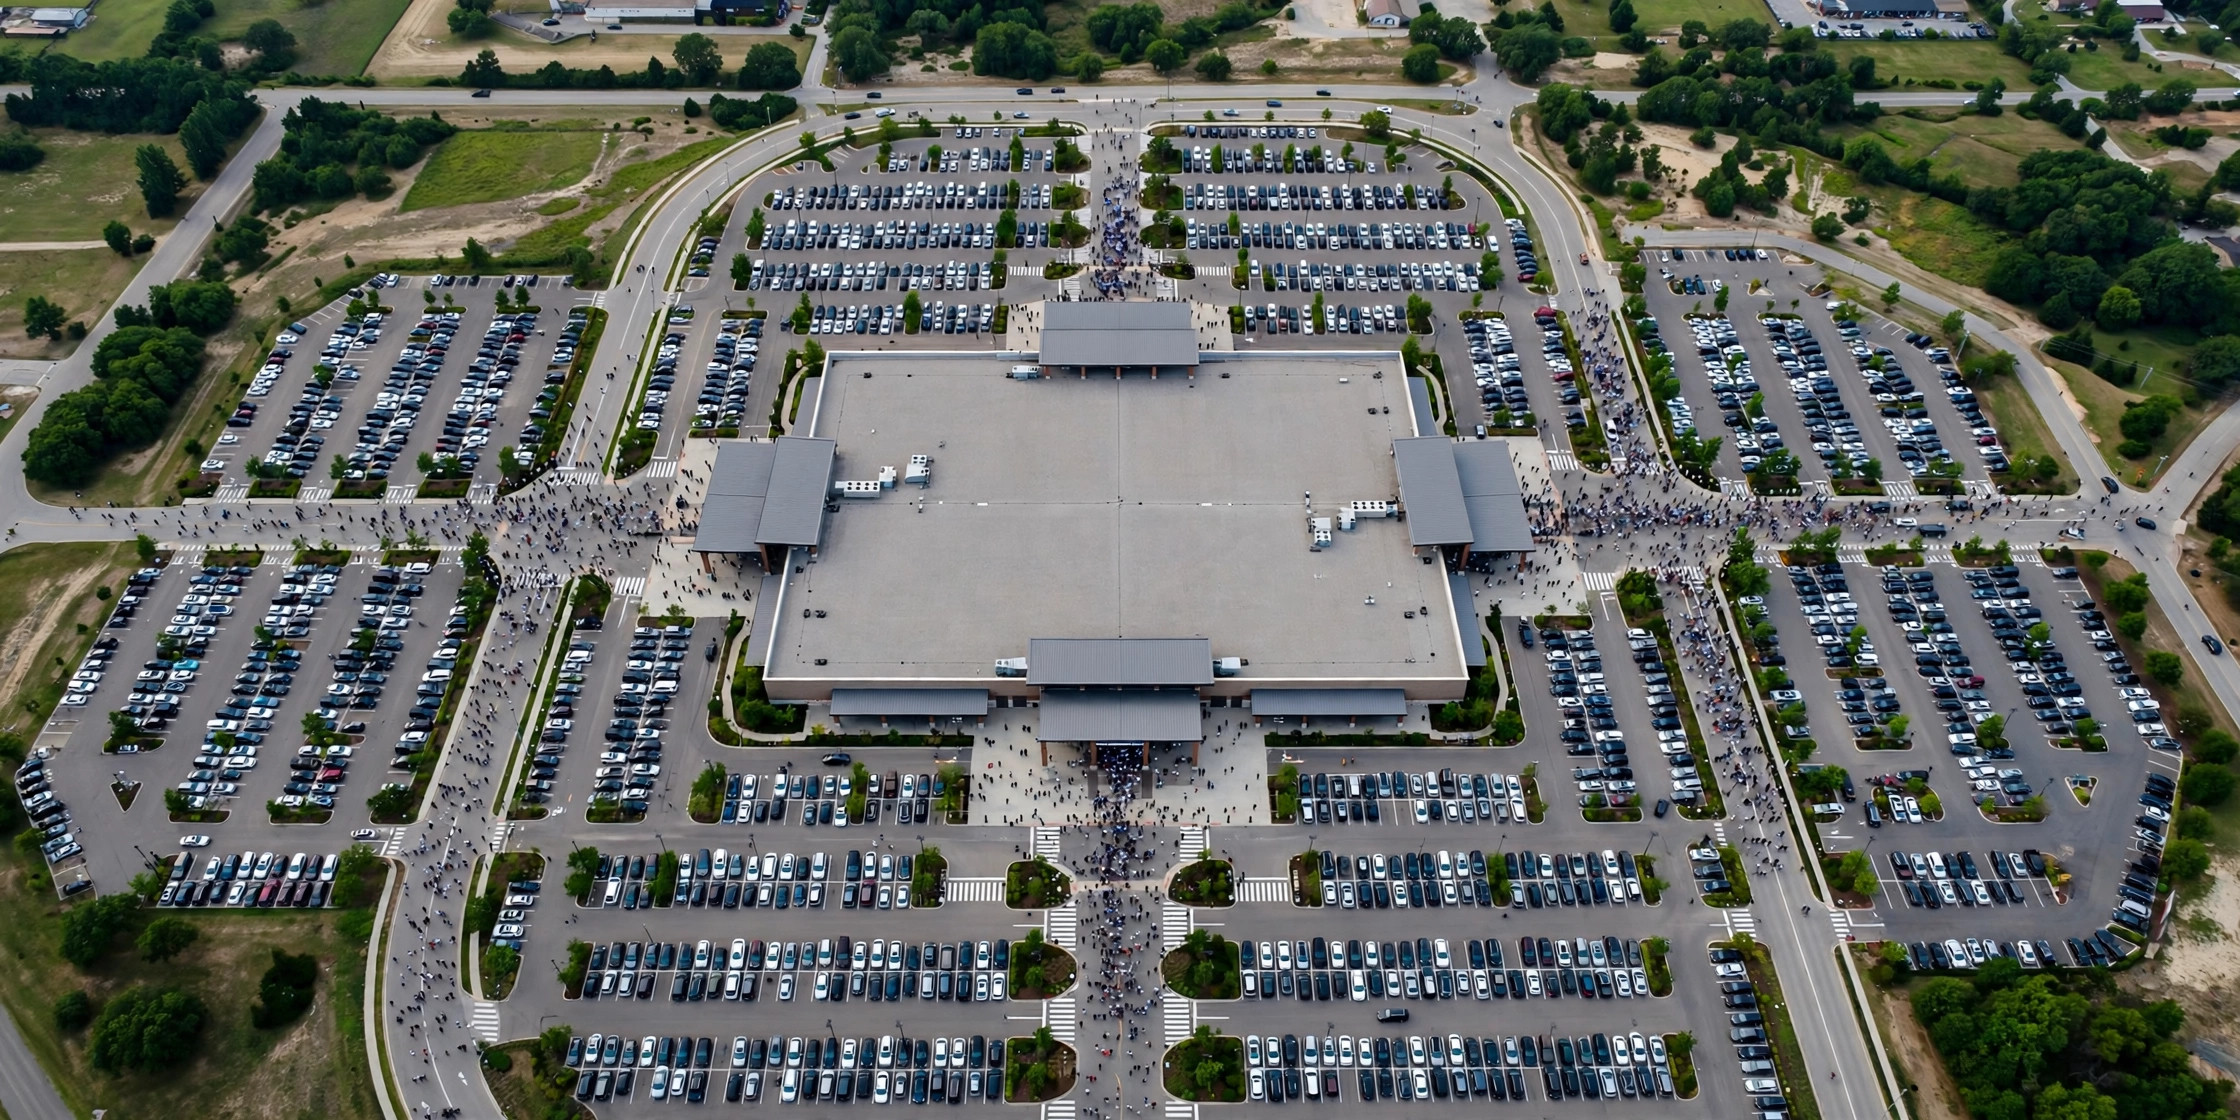
Parking deserves its own sentence in any composite visit: at malls and hospitals, the car park saturates before the place does, on a curve closer to the area-busyness of the surrounding streets — one more reason our pillar guide to the Busy Area feature on Google Maps recommends checking the district’s state alongside the destination’s graph for big composite trips.
Planning a multi-part visit: a worked method
Assemble the method on a real errand — a hospital visit with three legs: consultation, a blood test, and pharmacy.
- Read the parent graph and mark its valleys; the whole visit must live inside your day’s largest practical window.
- Check sub-listings: the diagnostic centre may have its own graph with an early-morning fasting-sample rush — schedule the test after that spike, not before your consultation if the order of legs allows.
- Sequence against the peaks, not with them: consultation in the OPD’s late-morning shoulder, test in the diagnostic lull that follows, pharmacy at its afternoon pattern rather than in the discharge-hour crush.
- Use the live bar on the morning itself as the final referee: if live reads “busier than usual,” flip the sequence — pharmacy first while the OPD mountain builds, consultation on its downslope.
The same four steps serve a mall expedition (anchor store, food court, cinema), a station journey (reservation counter, platform, metro interchange) and a government complex (application window, payment counter, document collection). Composite places reward sequencers: everyone else queues in the order the building suggests; you move through it in the order the data suggests, and the one graph you were given turns out to have contained four plans all along.
For the wait component inside such visits, our guide to Google Maps wait times completes the arithmetic — and remember that all of this data, parent and department alike, exists only because enough visitors shared their trips: Google explains the thresholds behind it in its Business Profile Help documentation on popular times, wait times and visit duration, which is why the biggest composite places, with their rivers of visits, are paradoxically the best-measured buildings on the map even as their single blended graph needs the most interpretation.
Case study: the mall with four doors
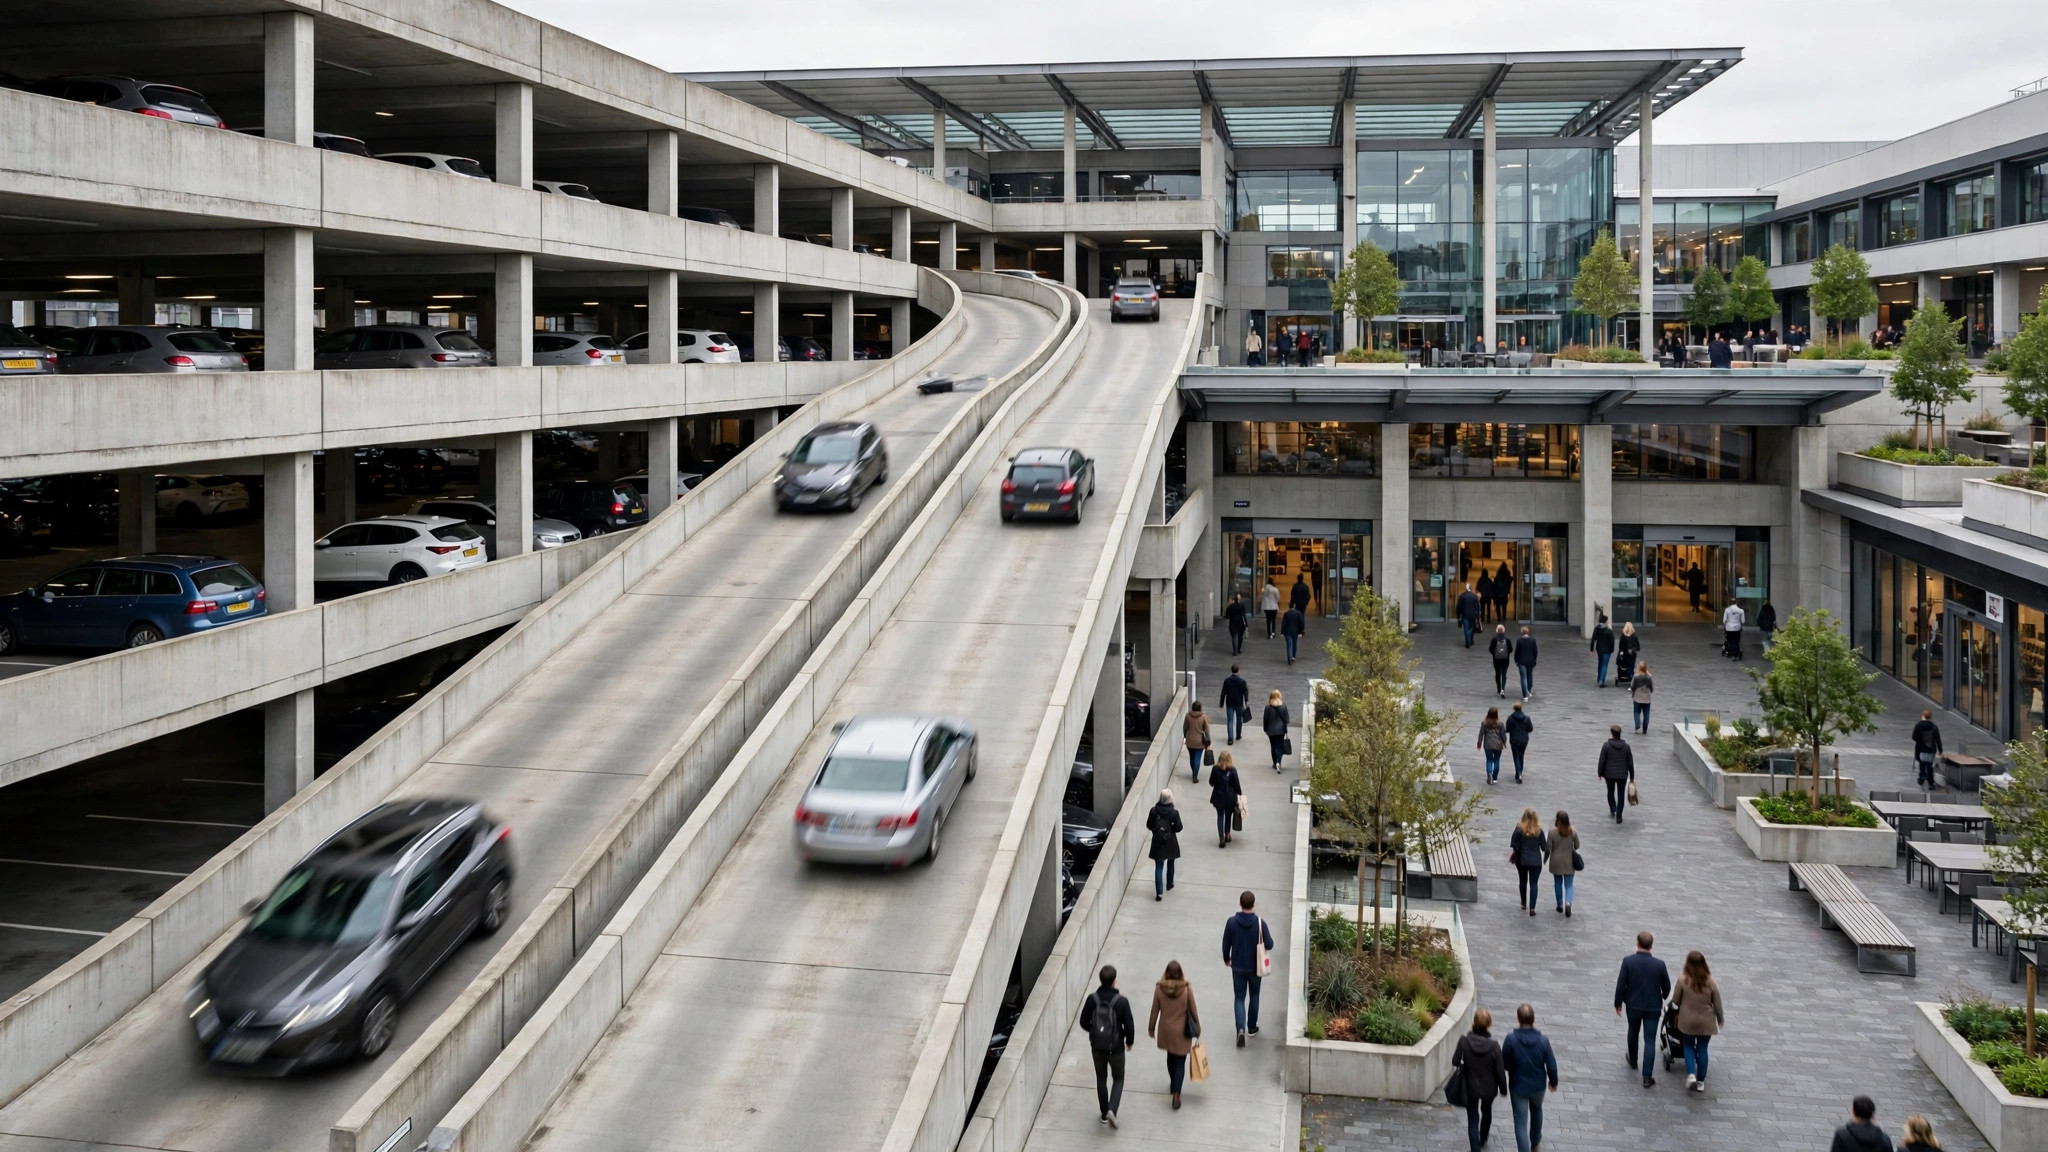
Watch the method work on a Saturday mall expedition with three errands: a phone to repair, groceries, and a film. The mall’s blended graph shows the familiar plateau from noon to 8 p.m. — useless, until decomposed. The phone brand’s service centre has its own listing: its graph peaks at 1 p.m. sharp, when every broken phone in the district arrives after lunch, and dips to near-nothing by 4. The supermarket inside the mall carries its own graph too, peaking an hour before the mall does, because grocery families come early and leave before the leisure crowd. The cinema’s listing shows no graph at all — its visits are pooled into the mall’s — but its showtimes are published, and showtime arithmetic (arrive twenty minutes before a screening, not five) replaces the missing bars.
Sequenced by data, the expedition runs: supermarket at 11, into its pre-peak; film at the 1:30 show, whose interval lands in the service centre’s post-peak dip; phone collected at 4:15; exit through the food-court-side door before the dinner wave makes that corridor the building’s throat. Nothing about the mall changed. Only the order did — which is the entire thesis of this article in one afternoon: at composite places, the crowd you meet is largely the crowd your sequence chooses.
When the blend actually helps you
Fairness to the single graph: blending is a feature wherever the parts share one fate. At a single-building attraction, a campus, a market complex, the blended peak warns you about the shared resources no sub-listing measures — the approach roads, the parking, the security funnel, the cloakroom. Sub-listings can all read calm while the one asset they share is overwhelmed, and only the parent’s graph, fed by every arrival at every door, sees the whole elephant.
So the mature reading is layered, not competitive: the parent’s graph for the commons (arrival, parking, security, the building’s general pressure), the departments’ own graphs for the desks and counters you will actually stand at, and the live bar at departure to referee between them on the day itself. Multi-entrance places ask for multi-layer reading; the data, spread across the listings, has been offering it all along to anyone willing to make one extra search.
Frequently asked questions
Why does a huge mall show one calm graph while its food court is packed?
Because the graph blends the whole footprint. The food court’s lunch spike is diluted by the calm corridors and morning-quiet stores around it. Check the food court’s own listing if it has one — its graph will tell the spicier truth.
Do entrances ever get separate listings?
Sometimes — major terminals, gates and wings of large institutions occasionally carry their own listings, usually where visitors search for them by name. It is always worth one search before a big visit.
Which graph should I trust for a department: the parent’s or its own?
Its own, for that leg of the visit. The parent’s graph remains the better guide for arrival, parking and the building’s overall pressure.
