

It can feel like magic: a road turns red on your phone minutes before you would have driven into the jam. There is no magic, and no army of traffic cameras behind it either. The answer to “how does google maps live traffic work” is a clever blend of millions of phones, road sensors, official reports and years of historical patterns.
This article unpacks each ingredient, how they combine, and where the system’s blind spots are. It is the traffic sibling of our explainer on where Google’s busy data comes from, which covers the place-crowd side of the same data machine.
how google map shows live traffic
How Google Map shows live traffic starts with your phone — possibly literally yours. When you use Google Maps with location services on, your phone periodically reports an anonymised position and speed to Google. One phone tells Google almost nothing. Millions of phones, on thousands of road segments, tell it nearly everything.
Google slices every road into segments and continuously compares the speeds being reported on each segment with the speed traffic normally achieves there. The result is translated into the four familiar colours: green for normal flow, orange for a slowdown, red for heavy congestion, and dark red for near-standstill. It works the same way for a place’s foot traffic — how Google knows how busy a place is uses the same aggregation idea, applied to people in a location instead of vehicles on a road.

how does google maps show live traffic
So how does Google Maps show live traffic so quickly after an incident? Speed of the pipeline matters at three points:
- Collection: Phones already moving on the road report speeds continuously, so a sudden slowdown registers within minutes of the first vehicles hitting it.
- Aggregation: Google does not need every car — a sample of reporting phones per segment is enough to grade the road once their speeds agree.
- Display: The traffic layer and your navigation ETA draw on the same live feed, which is why a worsening jam pushes your arrival time back mid-journey.
The system then cross-checks the live picture against the road’s normal pattern for that hour. A segment that is always slow at 9 a.m. needs a bigger deviation before it earns the darkest red than a highway that normally flows freely.
How does Google Maps know traffic?
The short answer: it measures traffic rather than guessing it. Google has described two families of inputs. The first is historical data — the average time it takes to travel each road segment at each time of day and day of week, built up over years. The second is real-time data from sensors and smartphones reporting how fast cars are actually moving right now.
Those two inputs balance each other. History tells Google what “normal” looks like, so it can recognise abnormal. Live reports tell it what is happening today, so an accident, a rainstorm or a festival crowd can override the normal pattern. Neither alone would work: history alone could never see today’s crash, and live data alone could not tell a routine rush hour from an unusual one.
How does Google Maps update live traffic?
Google Maps updates live traffic continuously rather than on a fixed schedule. As fresh speed reports arrive for a segment, its colour is re-graded. In practice, that means a busy highway can change shade within a few minutes of conditions shifting, while a quiet road with few reporting phones updates more slowly.
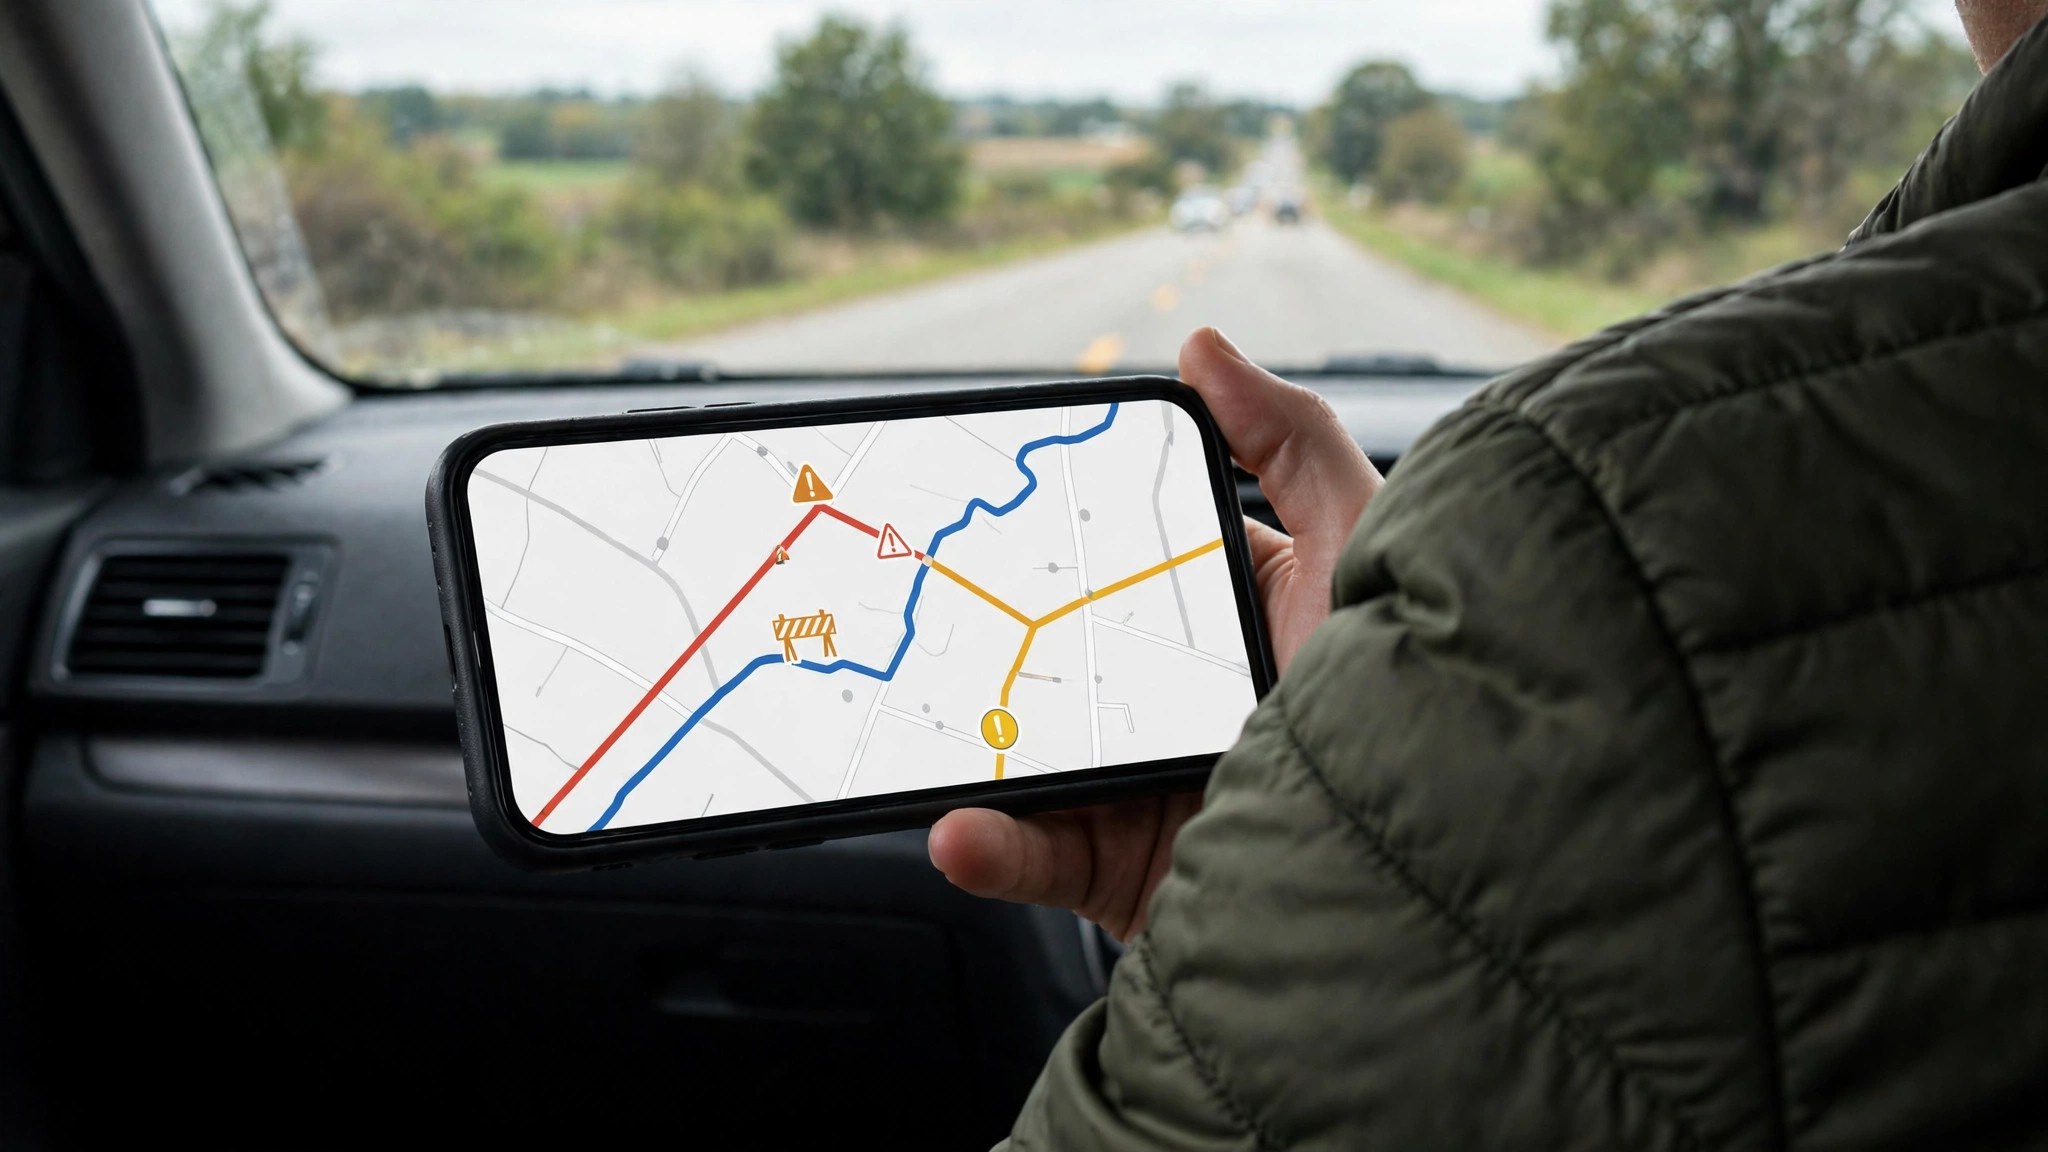
User reports feed the same loop. When drivers confirm a crash, a hazard or a speed check in the app — a feature that grew out of Google’s Waze acquisition — those reports appear as incident icons and help explain why a segment turned red. Transport agencies in many countries also supply closure and roadwork feeds that Google merges into the map, which is why planned roadworks often show before the cones are even out.
How does Google Maps know the traffic is bad?
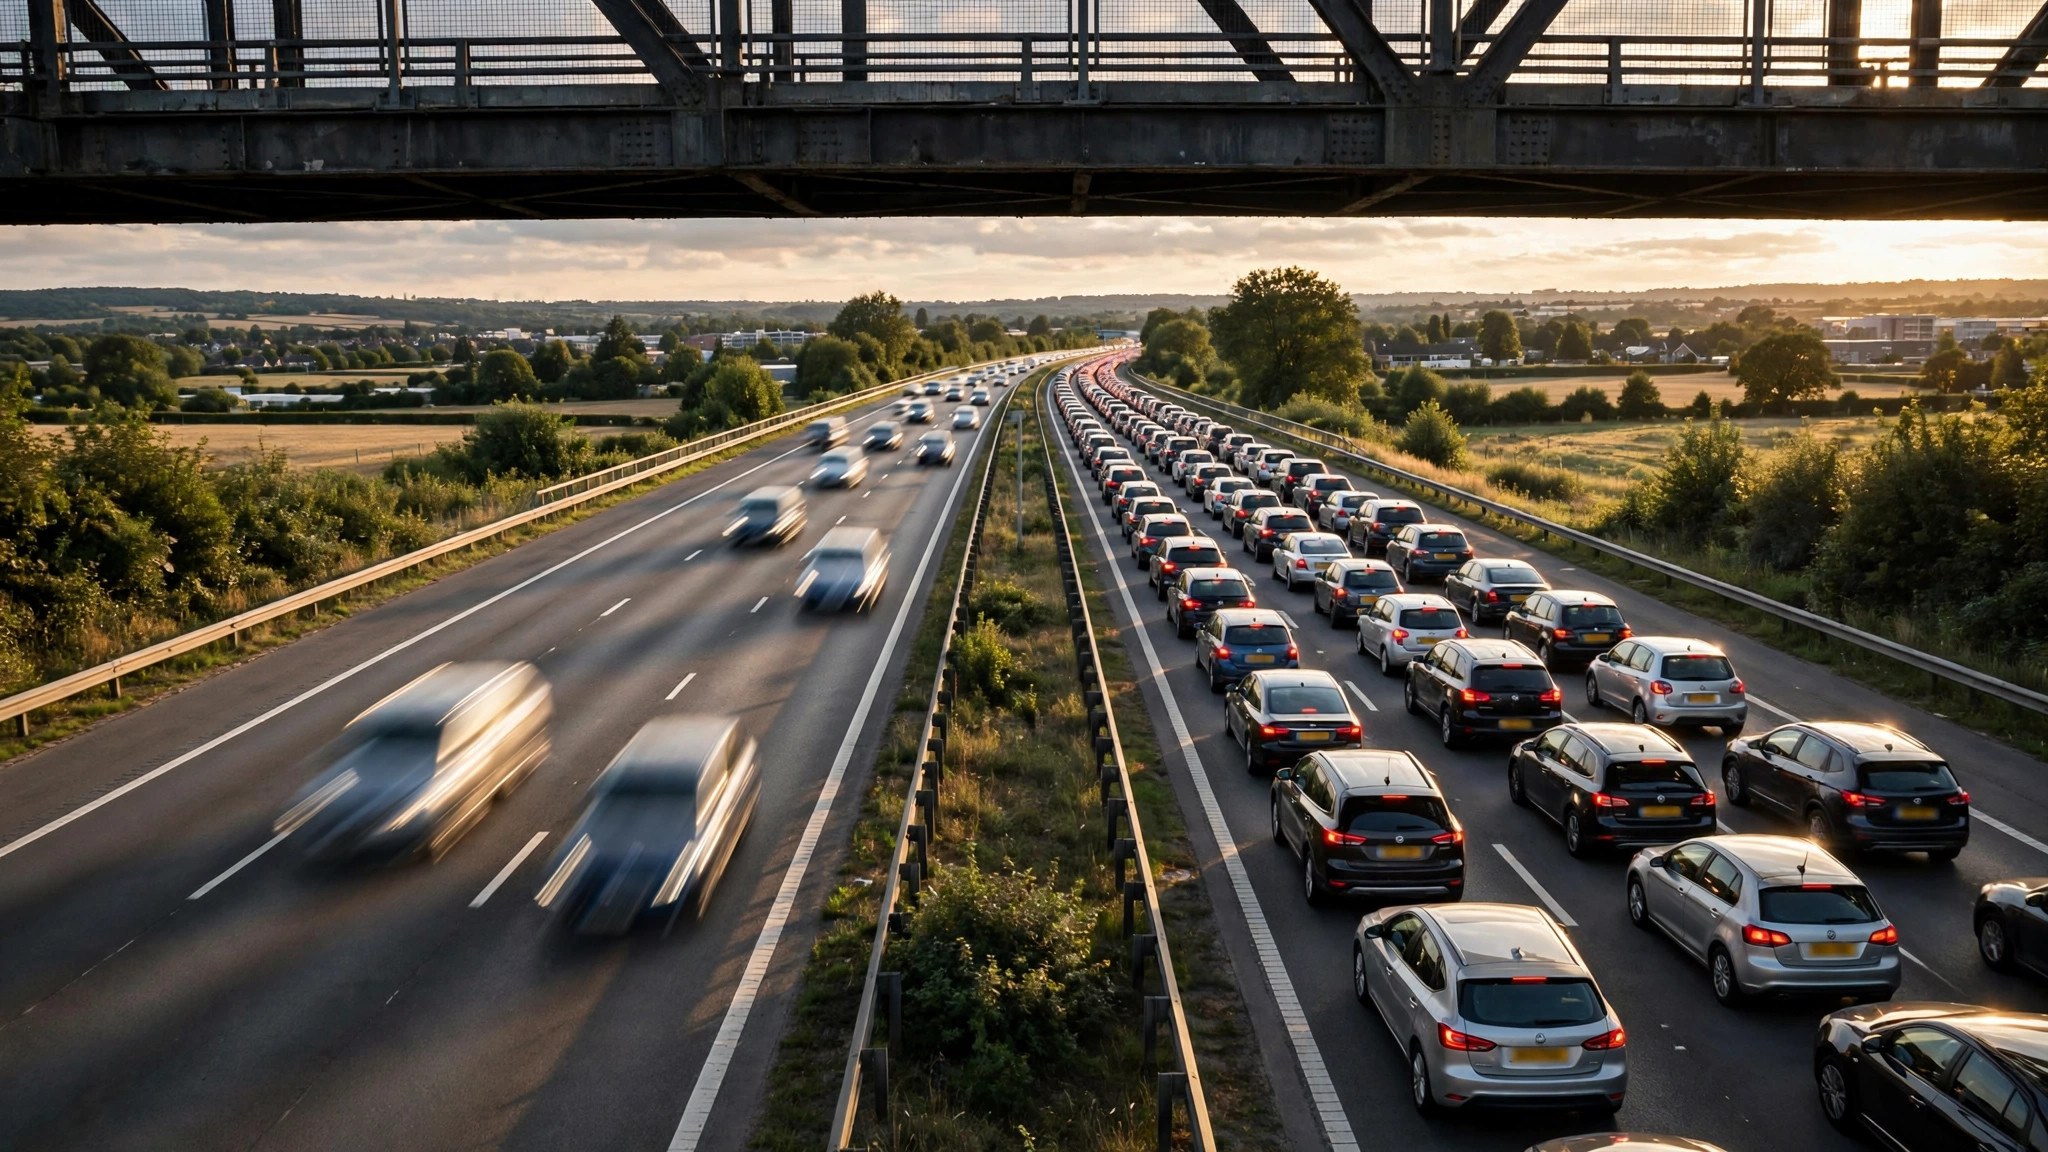
“Bad” is a comparison, not a fixed speed. Google Maps knows the traffic is bad when live speeds fall well below what that segment normally manages at that time. A road where cars average 20 km/h at rush hour every day is simply showing its normal self; the same 20 km/h on a road that normally flows at 80 km/h signals a serious problem.
This is also why the system grades your route’s delay rather than its raw speed. A ten-minute crawl through a city centre may be completely typical, while a ten-minute hold-up on an open highway is exceptional — and the map treats them differently, even though the stopwatch reads the same.
How is traffic measured on Google Maps?
Traffic is measured on Google Maps in anonymised, aggregated form. The pipeline looks roughly like this:
- Phones with location services enabled send periodic, anonymised speed and position pings while moving.
- Google maps those pings to road segments and calculates the actual average speed per segment.
- The actual speed is compared with the segment’s free-flow and historical speeds.
- The segment earns a colour, and the same data feeds ETA calculations and rerouting.
- Segments without enough pings stay uncoloured rather than guessed.
Privacy is engineered into the design Google describes: pings are stripped of identity, aggregated with many other drivers, and individual trips are not displayed. You are never watching a specific person’s car — you are watching a statistical average of everyone on that road.
How does Google determine live traffic?
Google determines live traffic by fusing everything above with context. Weather, public holidays, school terms and major events all bend the “normal” pattern, and the historical model accounts for the predictable ones. When live speeds deviate from even the adjusted expectation, that is when incident icons, closure banners and rerouting suggestions appear.
Rerouting uses the determination in real time. If your route’s segments degrade while a parallel route stays green, Maps compares total journey times — not just the jammed stretch — and offers the alternative only when it genuinely saves time. That is why it sometimes keeps you on a red-looking road: every alternative is red too, and yours is still the shortest path through the mess. For a practical pre-journey check, our guide to traffic near me shows how to read this picture before you leave.
How does Google Maps know where traffic is?
By knowing where the phones are — and, just as importantly, how fast they are moving between two points. A cluster of phones crawling along one segment and flowing on the next tells Google not only that a queue exists but where it starts and ends. That is how the red band on a highway so precisely matches the tail of the jam you eventually reach.
Road sensors and agency feeds anchor the picture in places where phone data is thin. In many countries, transport departments share loop-detector counts, toll-gantry timings and official incident reports, and Google blends those into the same colour system. Google documents the layer itself in its Maps Help page on map layers.
The historical baseline: how “normal” gets built
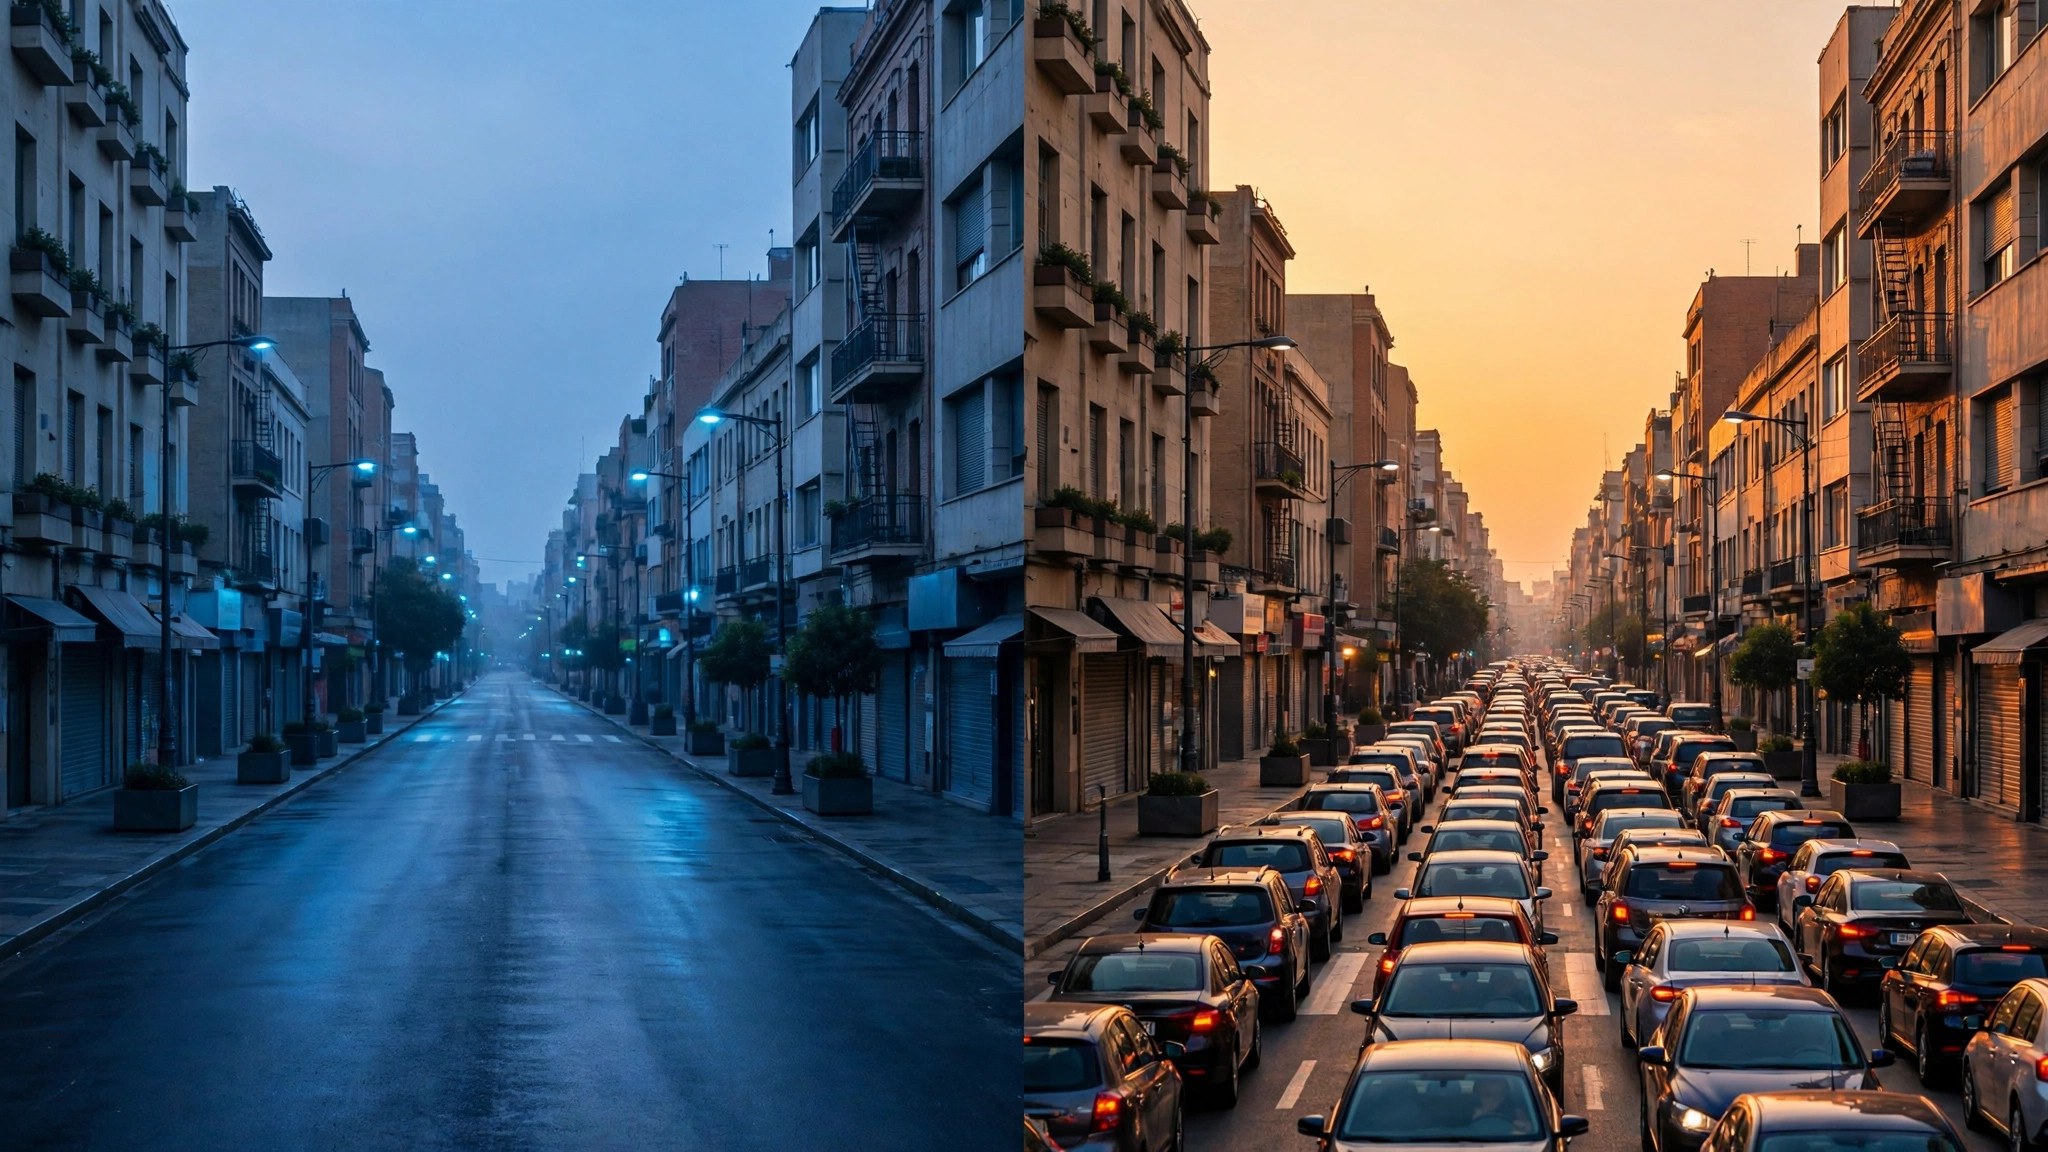
The historical half of the system deserves a closer look, because it quietly powers features you use without noticing. Every anonymised journey adds to a profile for that road segment: typical speeds by hour, by day of week, by season. Over years, those profiles become remarkably detailed — Google can “know” that a particular Bengaluru arterial slows every weekday at 8:45 a.m. but stays clear during school holidays.
That baseline is what powers the “typical traffic” view when you plan a future trip, the leave-by reminders that warn you about a slower-than-usual commute, and the sensible ETAs you get before a journey even starts. When live data is unavailable — say you are checking a route for next Sunday — the historical model alone carries the estimate, which is why those future ETAs come as a range rather than a single time.
The Waze connection: human reports on top of machine data
Google bought Waze in 2013, and the two apps have been quietly cross-pollinating ever since. The machine-measured speeds described above tell Google that traffic slowed; Waze-style human reports tell it why. When a driver taps to report a crash, an object on the road, flooding or a lane closure, that report surfaces in Google Maps as an incident icon for everyone behind them.
This human layer explains the map’s occasional prescience about causes. A red segment is data; a red segment with a crash icon and a “reported 12 minutes ago” note is data plus testimony. The reports are weighted and expire — an old, unconfirmed hazard fades rather than haunting the map all day — which keeps the layer honest without needing an official confirmation for every pothole.
Where the system has blind spots
Understanding how it works also explains the failures:
- Rural and low-traffic roads may show no colour at all — there are simply too few reporting phones, so Google shows nothing rather than a guess.
- The first minutes of an incident can be invisible until enough vehicles have slowed down to register.
- GPS drift in dense cities — tall buildings, tunnels and multi-level roads can briefly misplace vehicles, painting a short false slowdown.
- Special events that do not follow history, like an unplanned protest march, only appear once the live data overwhelms the historical expectation.
Frequently asked questions
Does Google Maps track me personally to build traffic data?
No. Google describes the data as anonymised and aggregated; individual journeys are not identifiable, and location sharing follows your own device settings.
Why does Maps sometimes know about a jam before local radio?
Because the phones in the queue are the first witnesses. Their speeds drop the moment the queue forms, long before an incident is officially reported.
Do iPhones contribute, or only Android phones?
Both. Any phone running Google Maps or Google services with location enabled can contribute anonymised data, which is why coverage is strong even in iPhone-heavy cities.
Why is a road red when I can see it moving?
The colour grades the whole segment against its normal pace. Traffic can be moving yet far slower than usual — that earns orange or red even without a complete standstill.
The short version
Live traffic is a measurement system, not a prediction trick: anonymised phone speeds, road sensors and agency feeds, all judged against each road’s historical normal. Once you know that, the colours stop being decoration — and start being the most honest traffic report you have. It also means you are part of the system every time you drive with Maps open: your anonymised slowdown today is the red line that saves someone else tomorrow.
