

The coloured roads in your app are the visible tip of something much bigger: Google Maps live traffic data, a continuously updating measurement of how the world’s roads are moving. Fleet managers price deliveries with it, cities study it, and hundreds of apps quietly depend on the same measurement philosophy — even when they cannot buy Google’s feed itself.
This guide maps the layer beyond the map: what the data is, what developers can and cannot access through Google’s APIs, how the ecosystem of traffic apps divides up, and what it means for you as a user whose own journeys help build the dataset. For the underlying sourcing story, read where Google’s busy data comes from alongside this piece.
google maps api live traffic
The Google Maps API live traffic question is the one developers ask first, and the answer is “partly”. Google Maps Platform does offer a Traffic layer in the Maps JavaScript API: developers can render the familiar coloured-road overlay inside their own web applications, subject to API keys, quotas and billing. What that layer gives them is the visualisation — the same live traffic tiles you see in Google Maps.
What the API does not hand over is the raw feed: the per-segment speeds, the historical profiles, the measured travel times as data. That dataset is Google’s crown jewels and is not sold as a bulk product. Developers who need traffic numbers rather than pictures work through Google’s routing APIs instead — the Routes API returns durations that account for traffic conditions, letting an app ask “how long from A to B now?” without ever seeing the underlying measurements. Google documents the available layers and services in the Google Maps Platform documentation.
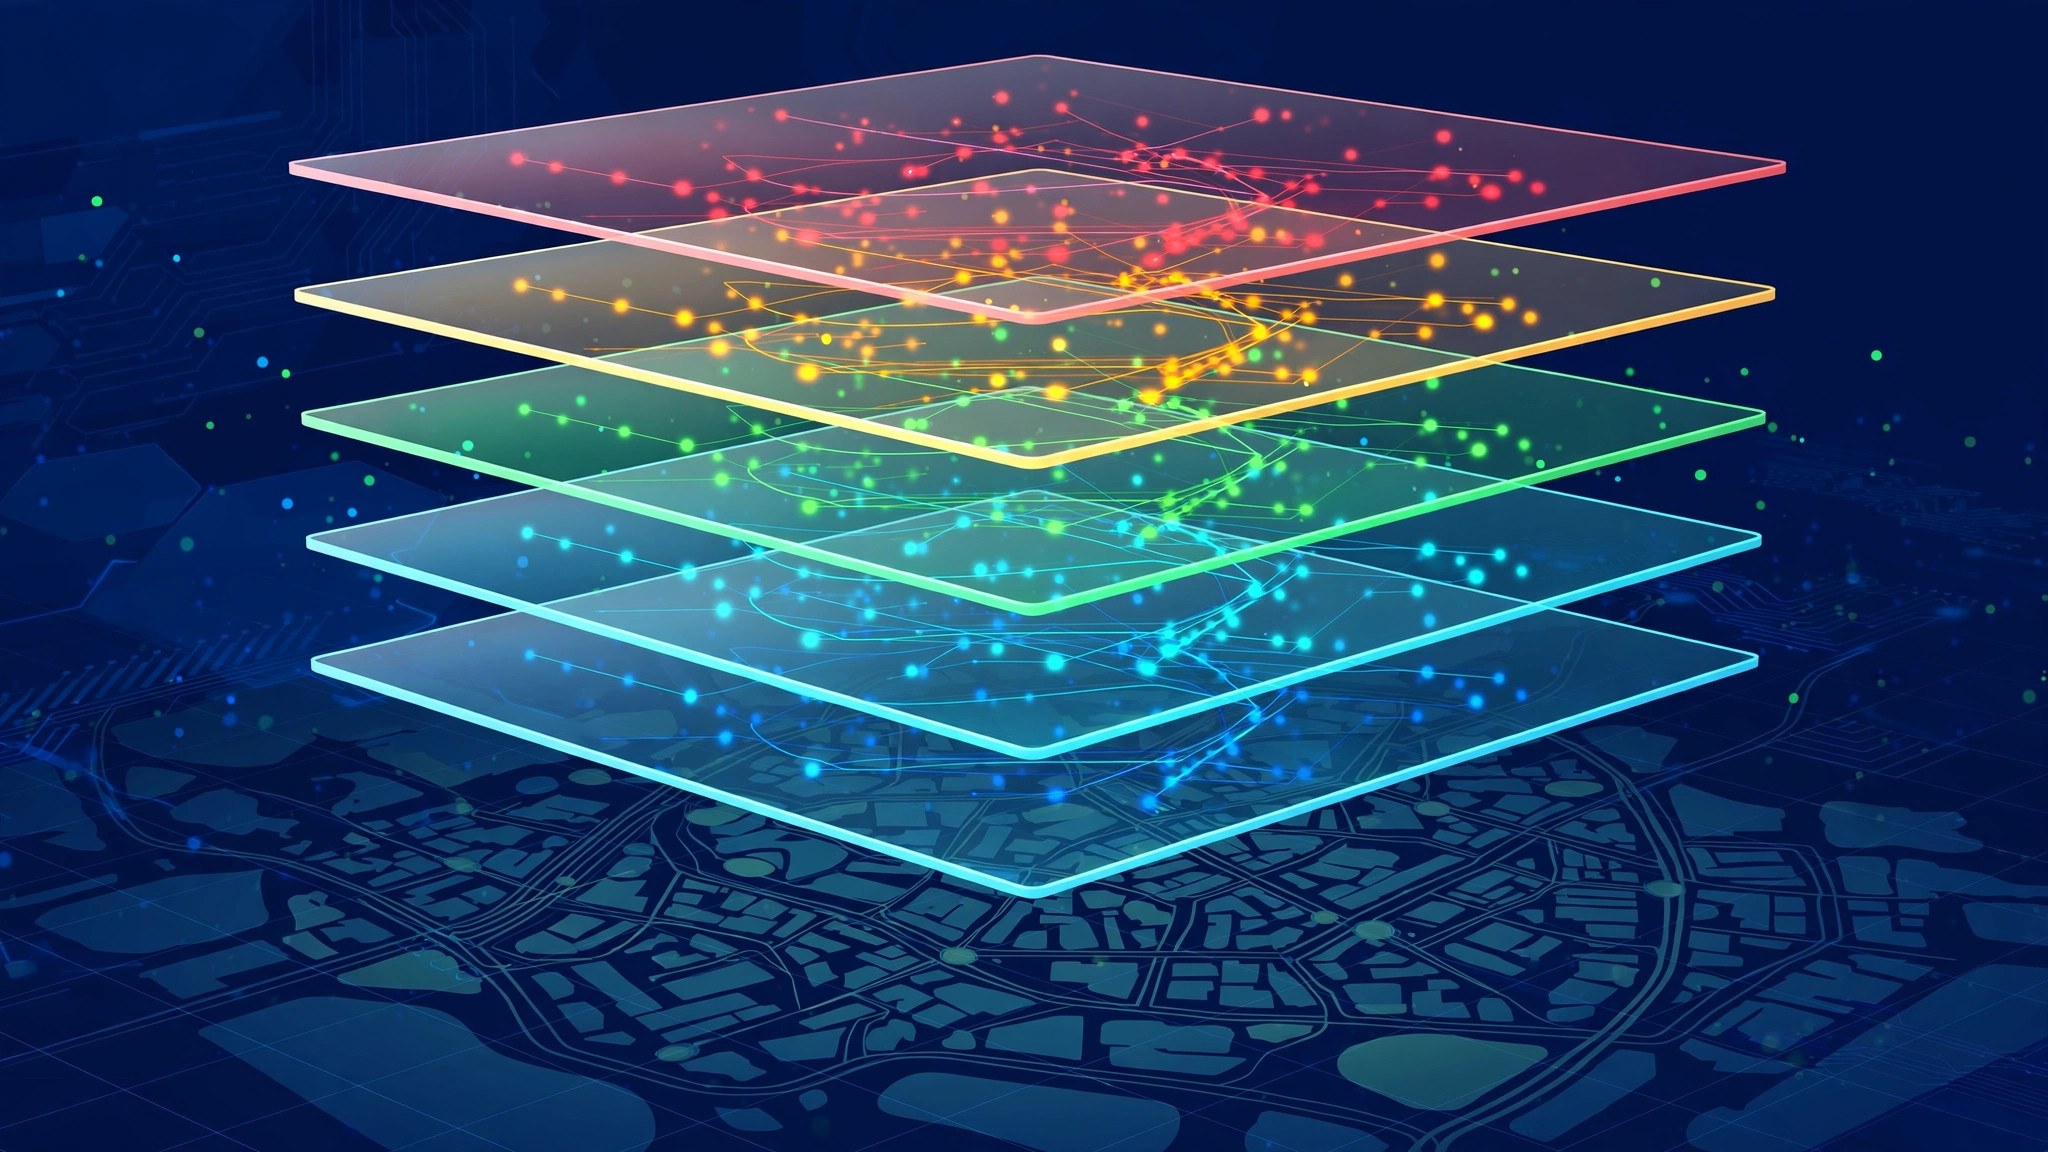
The data stack: four layers under the colours
It helps to picture the dataset as a stack, because each layer is what a different audience is allowed to touch:
- Raw measurements — anonymised speed and position reports arriving from phones, sensors and fleets. Nobody outside Google sees this layer.
- Segment grades — the computed picture: each road segment’s current speed versus its norm. This is the layer the colours represent, visible but not downloadable.
- Historical profiles — years of segment behaviour by hour and day, powering predictions and typical-traffic views. Glimpsed through planning features, never exported.
- Answers — ETAs, route choices, “leave by” prompts. This is the layer APIs sell: not the data, but decisions computed from the data.
Most confusion about “accessing Google traffic data” dissolves once the stack is clear. Display products rent layer two’s appearance. Routing products sell layer four. Layers one and three stay home.
google live traffic map
The Google live traffic map is the consumer face of the same system: the coloured overlay in the app and on the web. It is worth pausing on how unusual its business model is. The map is free to you because the data improves with every user, and every user is simultaneously a sensor. The live traffic map is not a product Google bought; it is a product its users continuously manufacture by driving with phones.
That flywheel explains the map’s moat. A rival can licence road geometry, hire map editors and even buy sensor feeds — but replicating a live measurement of most urban roads on Earth requires a reporting fleet of the same staggering size, and fleets like that cannot be purchased off the shelf.
google maps live traffic view
The Google Maps live traffic view you know — browsing with the layer on, or navigation with the route shaded — is deliberately a view, not an export. You cannot download yesterday’s traffic, query a segment’s history, or ask the consumer app for a corridor’s average Tuesday. The view answers present-tense questions and the ETA questions wrapped around them.
Researchers and businesses who need the historical or aggregate side use different doors: Google’s published mobility and traffic studies, city data partnerships, or third-party firms that build their own measurement from fleets and connected vehicles. The boundary is consistent with how Google treats the sibling dataset for places, a boundary we explore in popular times data and the API question: the crowd is shown, never sold by the segment.

google maps live traffic app
The Google Maps live traffic app experience differs between Android and iOS only at the edges — the data and grading are identical. Android adds system-level conveniences: the driving shortcut, the traffic widget, commute cards and deeper Assistant integration (“traffic to work” answered aloud). iOS offers the full in-app layer and navigation, with widgets of its own.
Both share the feature that matters for data freshness: because the app is the sensor as well as the screen, merely driving with it contributes anonymised measurements back into the pool. Every traffic app faces this dual role; Google’s simply operates at the largest scale, which is why its live view degrades last when you leave the big cities.
how to view live traffic on google maps
To view live traffic on Google Maps as data rather than backdrop, slow down and treat the map like an instrument panel:
- Turn on the traffic layer and zoom to the corridor level where minor arterials get graded.
- Read colours together with incident icons — colour for severity, icons for cause.
- Compare route ETAs for “Leave now” against two future departures to see the data’s forecast shape.
- On desktop, scrub the typical-traffic timeline to watch the city’s daily pattern the dataset has learned.
That routine turns the consumer view into the closest thing to the professional dashboards most users will ever need, and it is the same discipline behind our everyday traffic near me checks.
google map traffic app
The Google map traffic app landscape around Maps splits into three camps. First, the sibling: Waze, same parent, community-report heart. Second, platform rivals: Apple Maps, which has built its own measurement fleet from iPhones and now offers credible traffic and incident reporting in its strong markets; and regional champions in various countries that lean on local fleets or government sensor deals. Third, the specialists: fleet and logistics platforms that consume routing APIs — Google’s among them — and present traffic as ETAs and exception alerts rather than as a map at all.
For a driver, the practical ranking follows data depth in your city. For a business, the ranking follows API terms and routing quality. The common thread is that everyone in the landscape is either measuring roads themselves or renting someone else’s measurement — there is no third way to know how a road is moving.
Who builds on traffic data — and why it matters to you
The consumers of this measurement go far beyond drivers. Delivery and ride-hailing platforms live on traffic-aware ETAs: every “your rider is 6 minutes away” is a routing answer computed from somebody’s traffic data. Emergency planners study corridor profiles to site stations and time signals. Retailers analyse the flow past candidate storefronts the way they analyse footfall inside a mall. Insurers and city consultants buy analogous datasets from aggregators to model congestion, emissions and road risk.
Why should a regular user care? Because this demand is what funds the free map’s quality. The routing answers businesses pay for subsidise the measurement fleet that colours your commute. And the competitive pressure between measurers — Google, Apple, the fleet-data firms — is what keeps consumer traffic features improving rather than stagnating. Your free red line is the visible edge of a large, serious market in knowing how roads move.
What the data cannot do — and the privacy frame
Two limits deserve plain statement. First, the dataset measures vehicles with reporting phones; it is silent about pedestrians, cyclists without the app, and every road too quiet to measure — the map’s grey is an honest confession, not an oversight. Second, the whole system stands on a privacy bargain Google describes consistently: contributions are anonymised and aggregated, no individual’s journey is displayed, and participation follows your location settings.
That bargain is why the data exists at all. A traffic system people refused to feed would measure nothing; the aggregation design is what lets millions contribute without anyone being tracked in public. Users who opt out still benefit from everyone else’s data — the view is free to all — which is either generosity or the flywheel working as designed, depending on how you look at it.

Frequently asked questions
Can my business buy Google’s raw live traffic feed?
No. Google offers the traffic layer for display in apps and traffic-aware routing through its APIs, but the raw per-segment measurement feed is not a commercial product.
Is there a traffic API in Google Maps Platform?
There is a Traffic layer in the Maps JavaScript API for rendering the live overlay, and the Routes API returns traffic-aware travel times. Detailed speeds and history are not exposed.
Do third-party apps showing “live traffic” use Google’s data?
Some do, through the official APIs; others run their own measurement from their user base or licence data from traffic aggregators. The colours may look similar while the sources differ completely.
Why do logistics companies care about this data so much?
Because a fleet’s fuel, driver hours and delivery promises are all priced in minutes. Traffic-aware ETAs from an API are cheaper than the same knowledge bought with missed slots and idle trucks.
If Google will not sell the data, how do traffic data companies exist?
They measure independently: connected-vehicle fleets, delivery and taxi fleets, road sensors and their own apps. INRIX, TomTom and HERE built businesses this way long before app data dominated, and cities often prefer their neutral, contract-friendly feeds for official systems.
Does my own driving really change the data?
Yes, marginally and anonymously — in aggregate with thousands of others on the same roads. One phone never paints a road; a corridor of phones always does.
The short version
Behind the friendly coloured map sits one of the largest measurement systems ever built — and Google shares it carefully: pictures through the layer, answers through routing APIs, raw data never. Understanding that boundary explains both what your favourite traffic apps can do and why the grey roads stay grey for everyone. It also explains the map’s quiet economics: every driver is a customer and a sensor at once, every business ETA sold through an API helps pay for the fleet of phones that measures the roads, and the free live view in your pocket is the public face of a dataset that much of the transport world now plans around. Once you see the stack clearly — raw measurements at the bottom, grades and historical profiles in the middle, answers on top — the daily experience of the app makes a new kind of sense: you are not just reading the traffic, you are reading the surface of a system that never stops measuring.
