

Every Costco warehouse carries a crowd fingerprint, and Google Maps publishes it for free: the popular times graph on the warehouse’s listing. Costco popular times turn the vague wisdom of “weekends are mad” into an hour-by-hour picture of your specific store — when it fills, when it peaks, and where the quiet windows hide.
This guide teaches you to read that graph like a member who has studied it: what the bars mean, the shape a warehouse week takes, how the live bar updates the picture on the day, and how to turn all of it into a shopping schedule that avoids the crush. It builds on our companion piece, how busy is Costco right now, which covers the live-check routine itself.
Where to find Costco popular times
The graph lives on the warehouse’s Google listing, in Maps or Search:
- Search for your warehouse by name and city.
- Open the listing and scroll past hours and reviews to Popular times.
- Use the day selector to move through the week — the graph reshapes completely between, say, Tuesday and Saturday.
- During opening hours, watch for the live bar standing out from the typical bars, with a label like “Live: A little busy” or “Busier than usual”.
Under the graph you may also see a visit-duration line (“People typically spend 45 min to 1.5 hr here”), which matters for planning: a Costco trip is a block of time, not a dash, and the quietest hour is worth more when the visit itself is long.

How to read the graph
Popular times bars are relative, not absolute. Each bar shows how busy that hour typically is compared with the warehouse’s own busiest hour of the week — the tallest bar (usually Saturday around midday) defines 100%, and everything else is scaled against it. Google’s Business Profile Help on popular times explains that the graph is built from average popularity over recent months, from aggregated, anonymised visits.
Three reading skills follow from that:
- Compare shapes, not heights, between warehouses. A “60%” hour at a giant flagship may hold more people than a “100%” hour at a small warehouse.
- Trust the shape more than the label. “Usually a little busy” at 10 a.m. Tuesday plus a short flat bar tells you more than either alone.
- Read the shoulders. The hours where the graph climbs and falls — 10–11 a.m. and 4–6 p.m. — are where timing decisions pay: arriving on the falling shoulder beats arriving on the rising one.
The shape of a Costco week
Warehouse weeks follow a rhythm so consistent that the graph of almost any location rhymes:
- Monday — moderate. Weekend overflow and restockers; calmer than the weekend, busier than midweek.
- Tuesday–Thursday — the quiet band. Mid-morning and mid-afternoon troughs are the deepest of the week.
- Friday — two humps: a lunchtime swell near office areas and a strong after-work climb as weekend stocking begins.
- Saturday — the peak. A steep climb from opening to a late-morning/early-afternoon summit, then a long decline.
- Sunday — a compressed version of Saturday, often starting later and ending earlier, with a distinct pre-week stock-up flavour.
Overlay the special patterns: coupon-book launches lift the whole week; the run-up to major holidays stretches Saturday’s shape across several days; the first weekend of the month often out-draws the third. The graph absorbs recurring patterns over time — a new warehouse or a changed neighbourhood takes some months to settle into an honest shape.
The quietest windows, hour by hour
Translating the graph into a schedule, the windows members prize are:
- Weekday opening + 1 hour — the doors-open rush of regulars has cleared, shelves are full, aisles empty.
- Tuesday–Thursday, 3–5 p.m. — the great lull: lunch crowd gone, after-work crowd not yet arrived, checkouts short.
- Weekday final hour — quiet floors; accept thinner fresh stock and a hurry-up atmosphere near closing.
- Rainy weekday evenings — the weather wildcard; the live bar confirms these surprise windows on the day.
And the windows to avoid, unless the trip cannot move: Saturday 11 a.m.–3 p.m., Sunday afternoon, Friday after 5 p.m., and any day in the pre-holiday week. Our explainer of the popular times graph goes deeper on reading bars, peaks and the live overlay if you want the full method.
Live vs typical: which to trust on the day
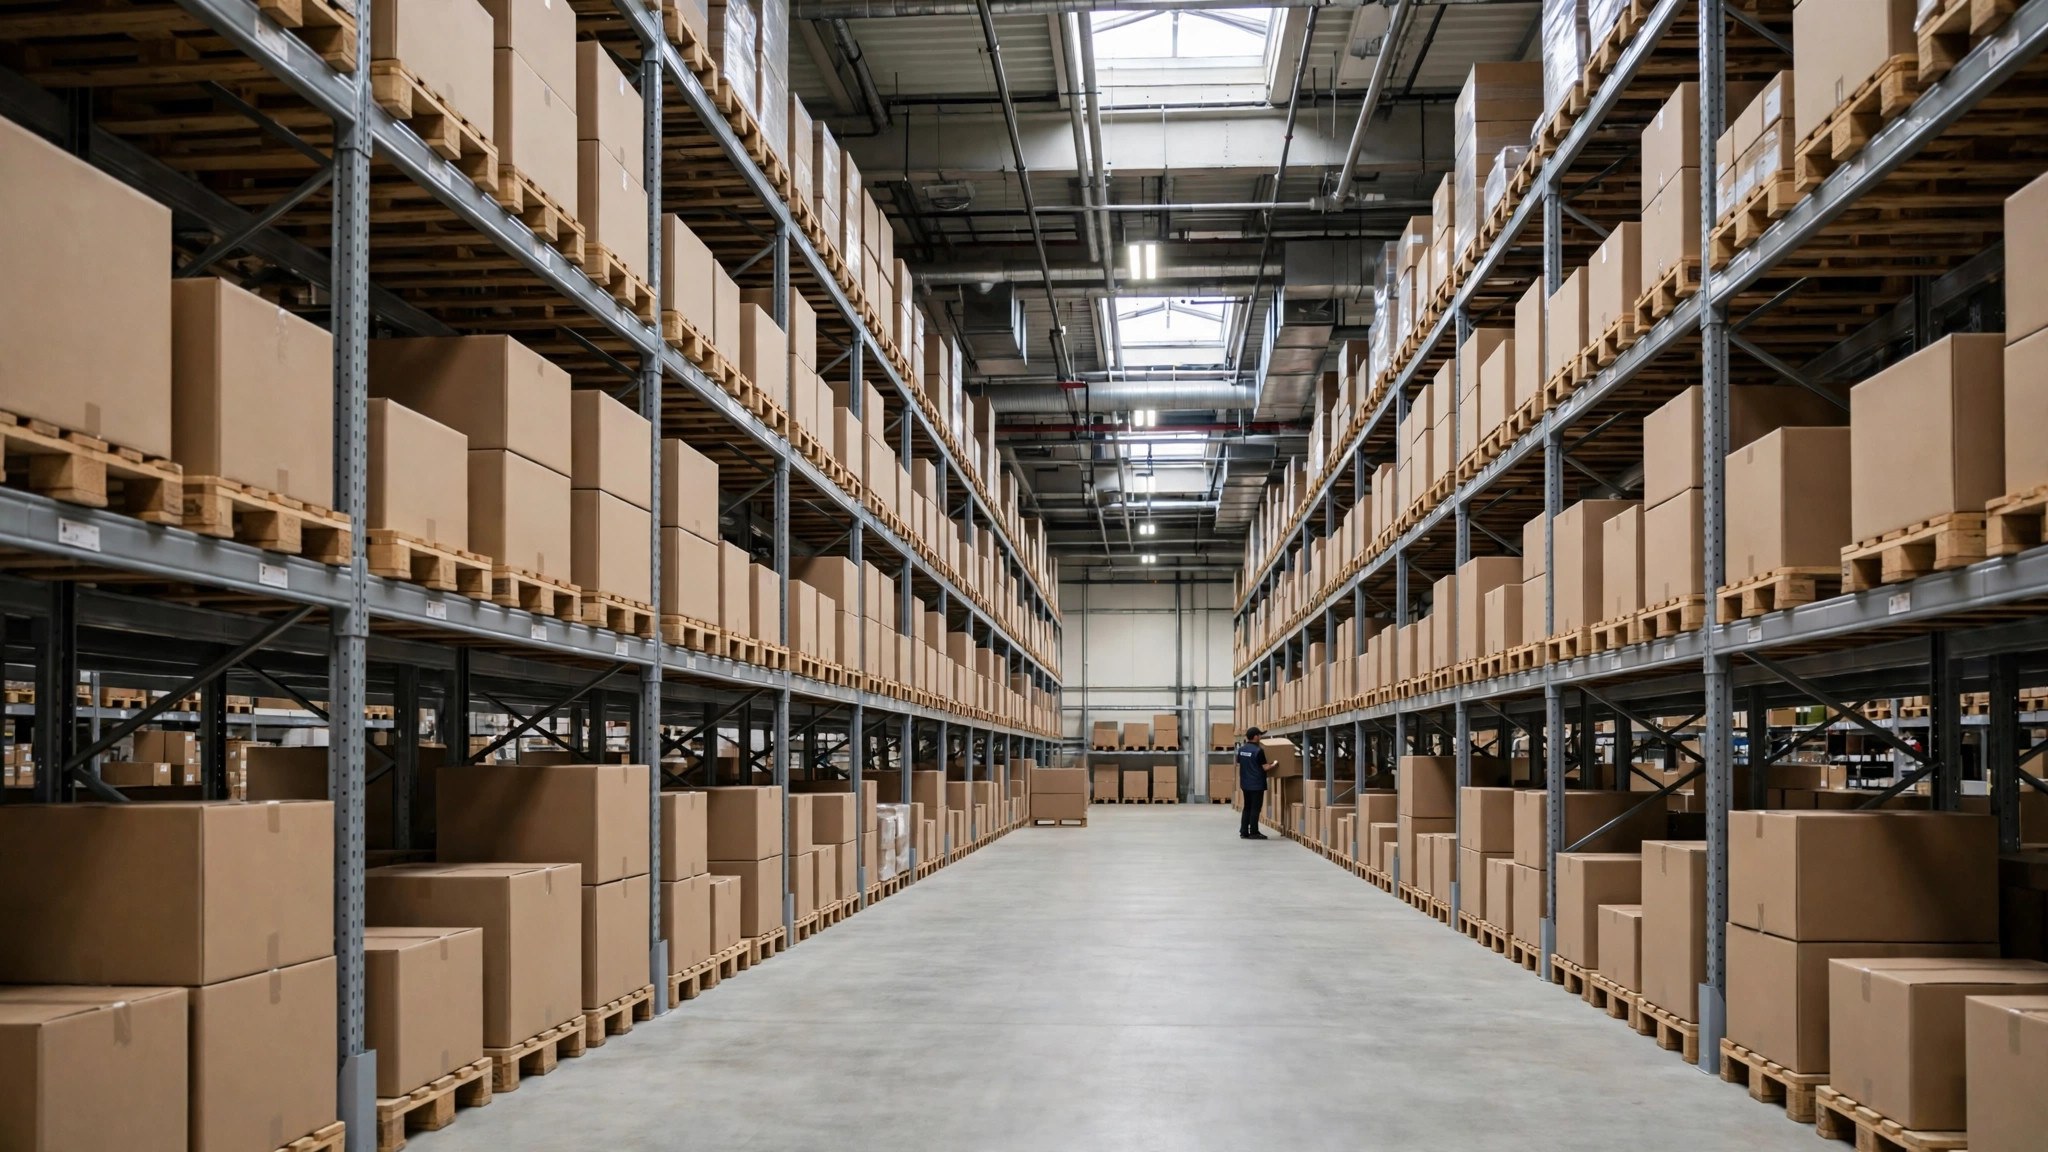
The graph is history; the live bar is today. When both are available, the live bar wins for the decision “go now or wait”, because it already contains today’s weather, today’s local event, today’s anomaly. The graph wins for planning further ahead — choosing which day this week to schedule the big shop, or whether next Saturday’s party run should move to Thursday evening.
A useful habit: plan the trip on the graph the night before; confirm it on the live bar as you leave. When the two disagree — a typically quiet Tuesday running hot because of a sale launch — believe the live bar and, if you can, slide the trip into the graph’s next quiet window.
Popular times inside the warehouse: departments keep their own hours
The listing gives one graph for the whole warehouse, but experienced members know the building is really several crowds sharing a roof:
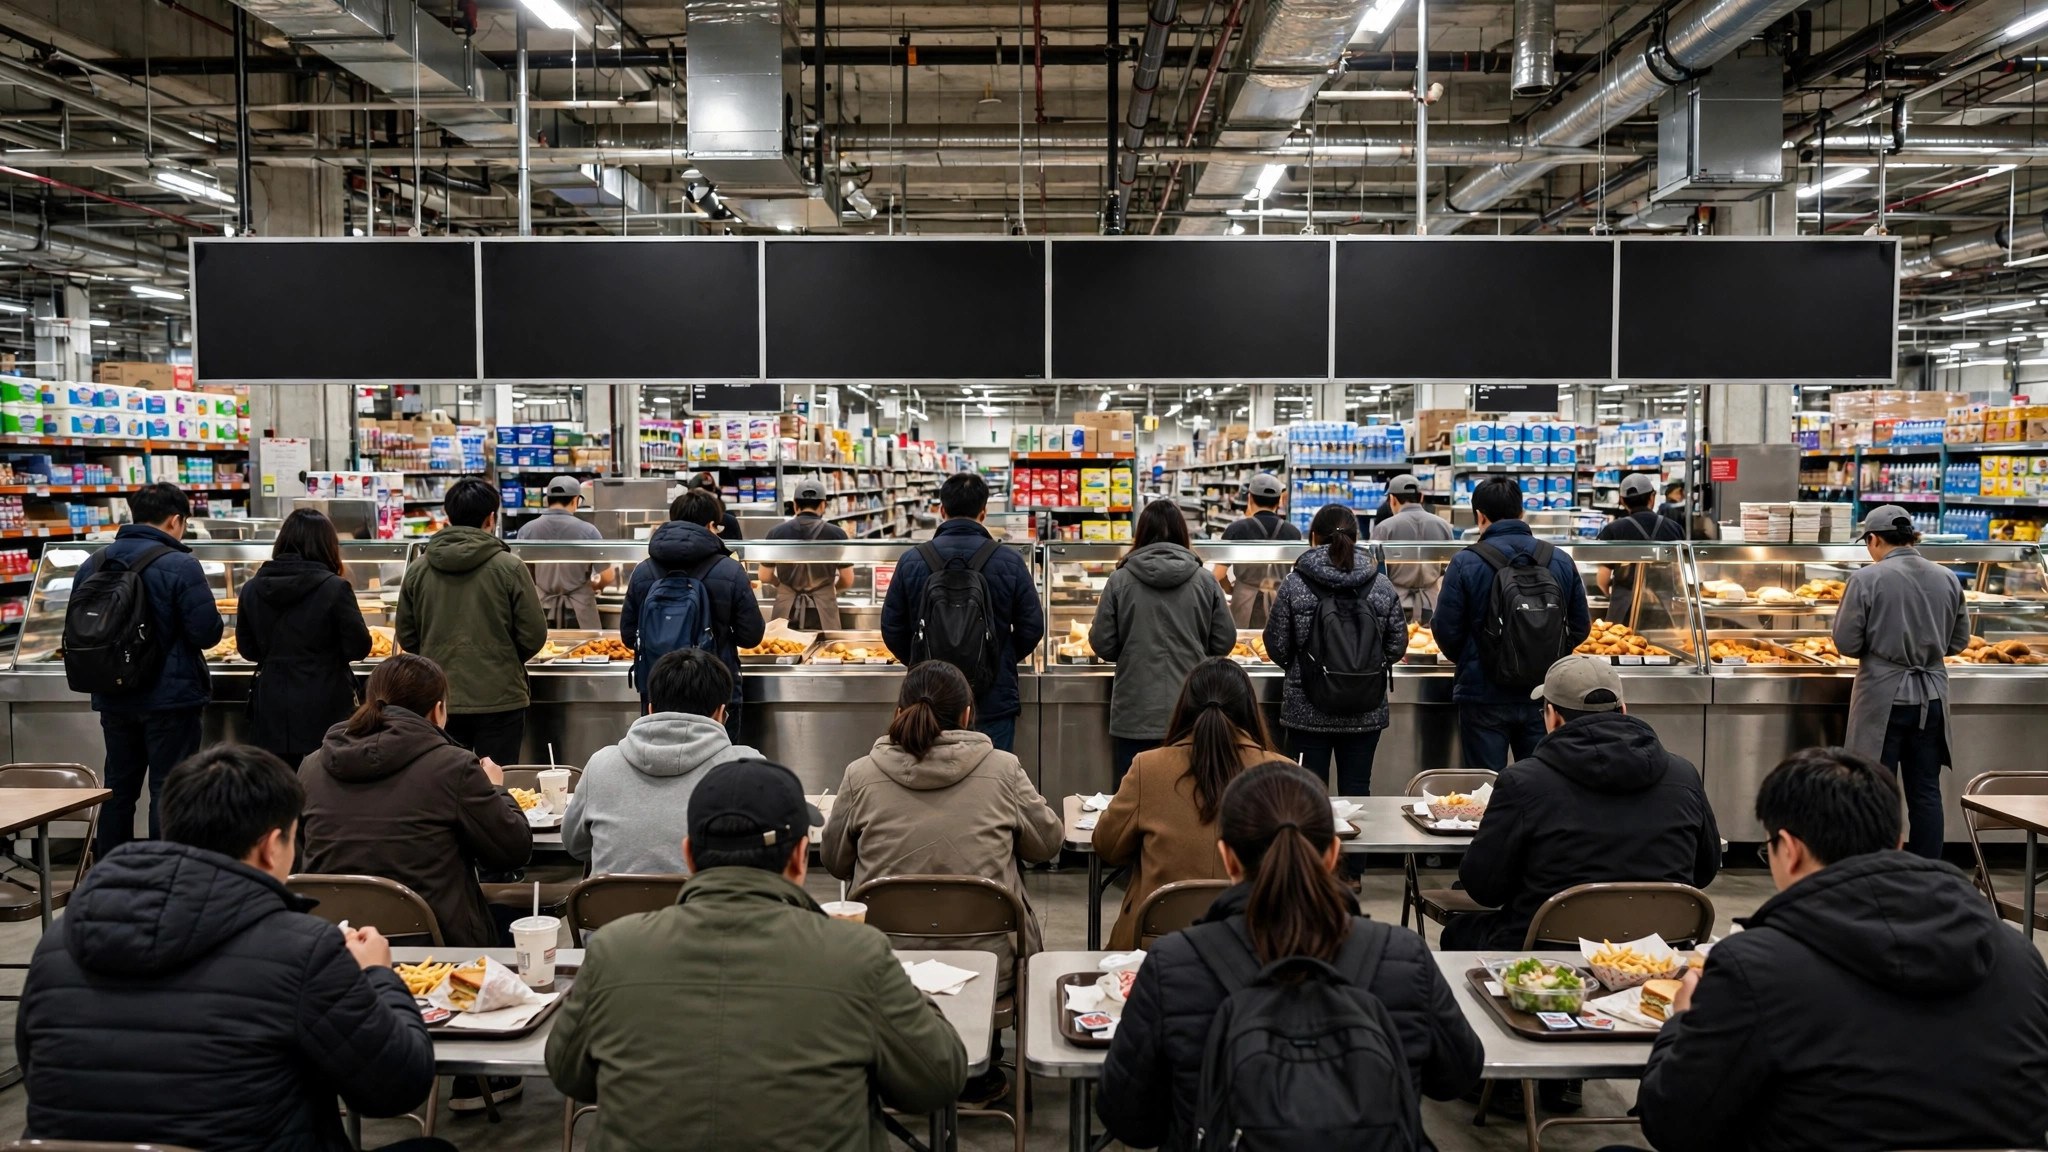
- The food court peaks at lunchtime — including on weekdays when the floor is calm — because it serves workers and visitors who may not shop at all.
- The pharmacy and optical counters wear a weekday, working-hours rhythm, busiest late morning and again after work, and quietest mid-afternoon.
- The tyre centre and services desks spike on Saturday mornings, when the week’s car problems arrive at once; booking ahead matters more than arrival timing there.
- The fuel station, where the warehouse has one, runs its own earlier curve: a morning queue of commuters and a weekend build that can precede the store’s peak by an hour.
The practical use: time your trip for the department you actually need. A pharmacy run belongs in the floor’s quiet windows anyway, but a tyre appointment on Saturday should be booked for opening, and a food-court lunch is best taken before noon or after two.
How the graph bends across the year
Because popular times are built from recent months, the graph breathes with the seasons, and members who check quarterly see it move:
- The pre-holiday stretch (the weeks before the biggest festivals and year-end holidays) inflates nearly every bar, and creates weekday-evening peaks the rest of the year never sees.
- ** January calm** follows it — the year’s deepest troughs, when even Saturdays soften.
- Summer patterns shift crowds earlier in hot regions: morning bars grow, midday bars sag in the heat, and evening shopping stretches later.
- Back-to-school and seasonal range launches put temporary shoulders on late-summer and early-autumn weekends.
None of this requires memorising: the graph you read this week already contains this season’s shape. The skill is simply to re-read it when the season turns instead of trusting the rhythm you learned in another quarter.
Why your warehouse’s graph differs from the next town’s
Popular times are per-location, and warehouse catchments differ: a warehouse beside office parks wears a weekday lunch hump; one in a residential suburb peaks harder on weekends; one near a border or a tourist corridor has its own exotic pattern. Executive membership mix, fuel station presence, and local paydays all leave fingerprints. This is why generic “best time to shop at Costco” advice is only a starting point — the last word always belongs to your own warehouse’s bars.
It is also why the crowd patterns across the big clubs rhyme without matching, a comparison we develop in warehouse club crowd patterns across Sam’s Club, BJ’s and Costco.
A worked example: moving one shop from Saturday to Thursday
Consider the most common rescue the graph performs. Your warehouse’s Saturday bars climb from opening, crest around midday at the week’s maximum, and stay high until mid-afternoon. Thursday’s bars, by contrast, sit at a fraction of that height, with a visible dip in the mid-afternoon. The same forty-item shop that costs you two hours on Saturday — parking, aisles, checkout, exit — typically costs barely over an hour in Thursday’s dip, and the hour you save is the most congested hour of your week.
The graph cannot give you your Thursday evening back if work forbids it — but it can tell you the second-best move with equal clarity. If the weekend is unavoidable, Saturday’s first hour after opening is usually half the crowd of Saturday midday, and Sunday’s decline in the last two hours beats Sunday’s peak. Every step down the graph’s ladder is time returned, and the ladder is printed on the listing for anyone to read. That is the entire promise of popular times: not a secret, just a published pattern that most shoppers never look at.

Frequently asked questions
How far ahead can popular times plan my trip?
The graph shows typical patterns for each day of the week, so it plans any week ahead at the “which day, which hour” level. For today’s exact crowd, use the live bar.
Does the graph change over time?
Yes. It is rebuilt from recent months of visits, so new patterns — a new housing estate nearby, changed opening hours — gradually reshape it.
Why does my warehouse show no popular times at all?
The feature needs enough visits from users who share location data. New or low-traffic locations may not qualify yet; most established warehouses do.
Is Saturday really always the peak?
At the overwhelming majority of warehouses, Saturday late morning to mid-afternoon is the tallest bar of the week. Your graph is the authority for your store — check its shape rather than assuming.
What does “people typically spend” tell me alongside popular times?
It is your trip-length estimate. A warehouse where people typically spend an hour or more rewards quiet-window timing twice over: you avoid both the crowd and the longer checkout tail that a crowd creates, so the saving compounds.
The short version
Costco popular times convert crowd folklore into a timetable: midweek mid-mornings and the 3–5 p.m. lull are the quiet water; Saturday midday is the rapids. Read your own warehouse’s graph, plan on its shape, confirm with the live bar on the day — and the big shop stops being an ordeal you endure and becomes a slot you choose. Keep the habit light: one glance at the graph when you plan the week’s shopping, one glance at the live bar before you leave. That is all the discipline the system asks for, and it pays you back in the currency warehouse shoppers value most — an empty aisle and a short line, on a trip that used to cost you both.
