
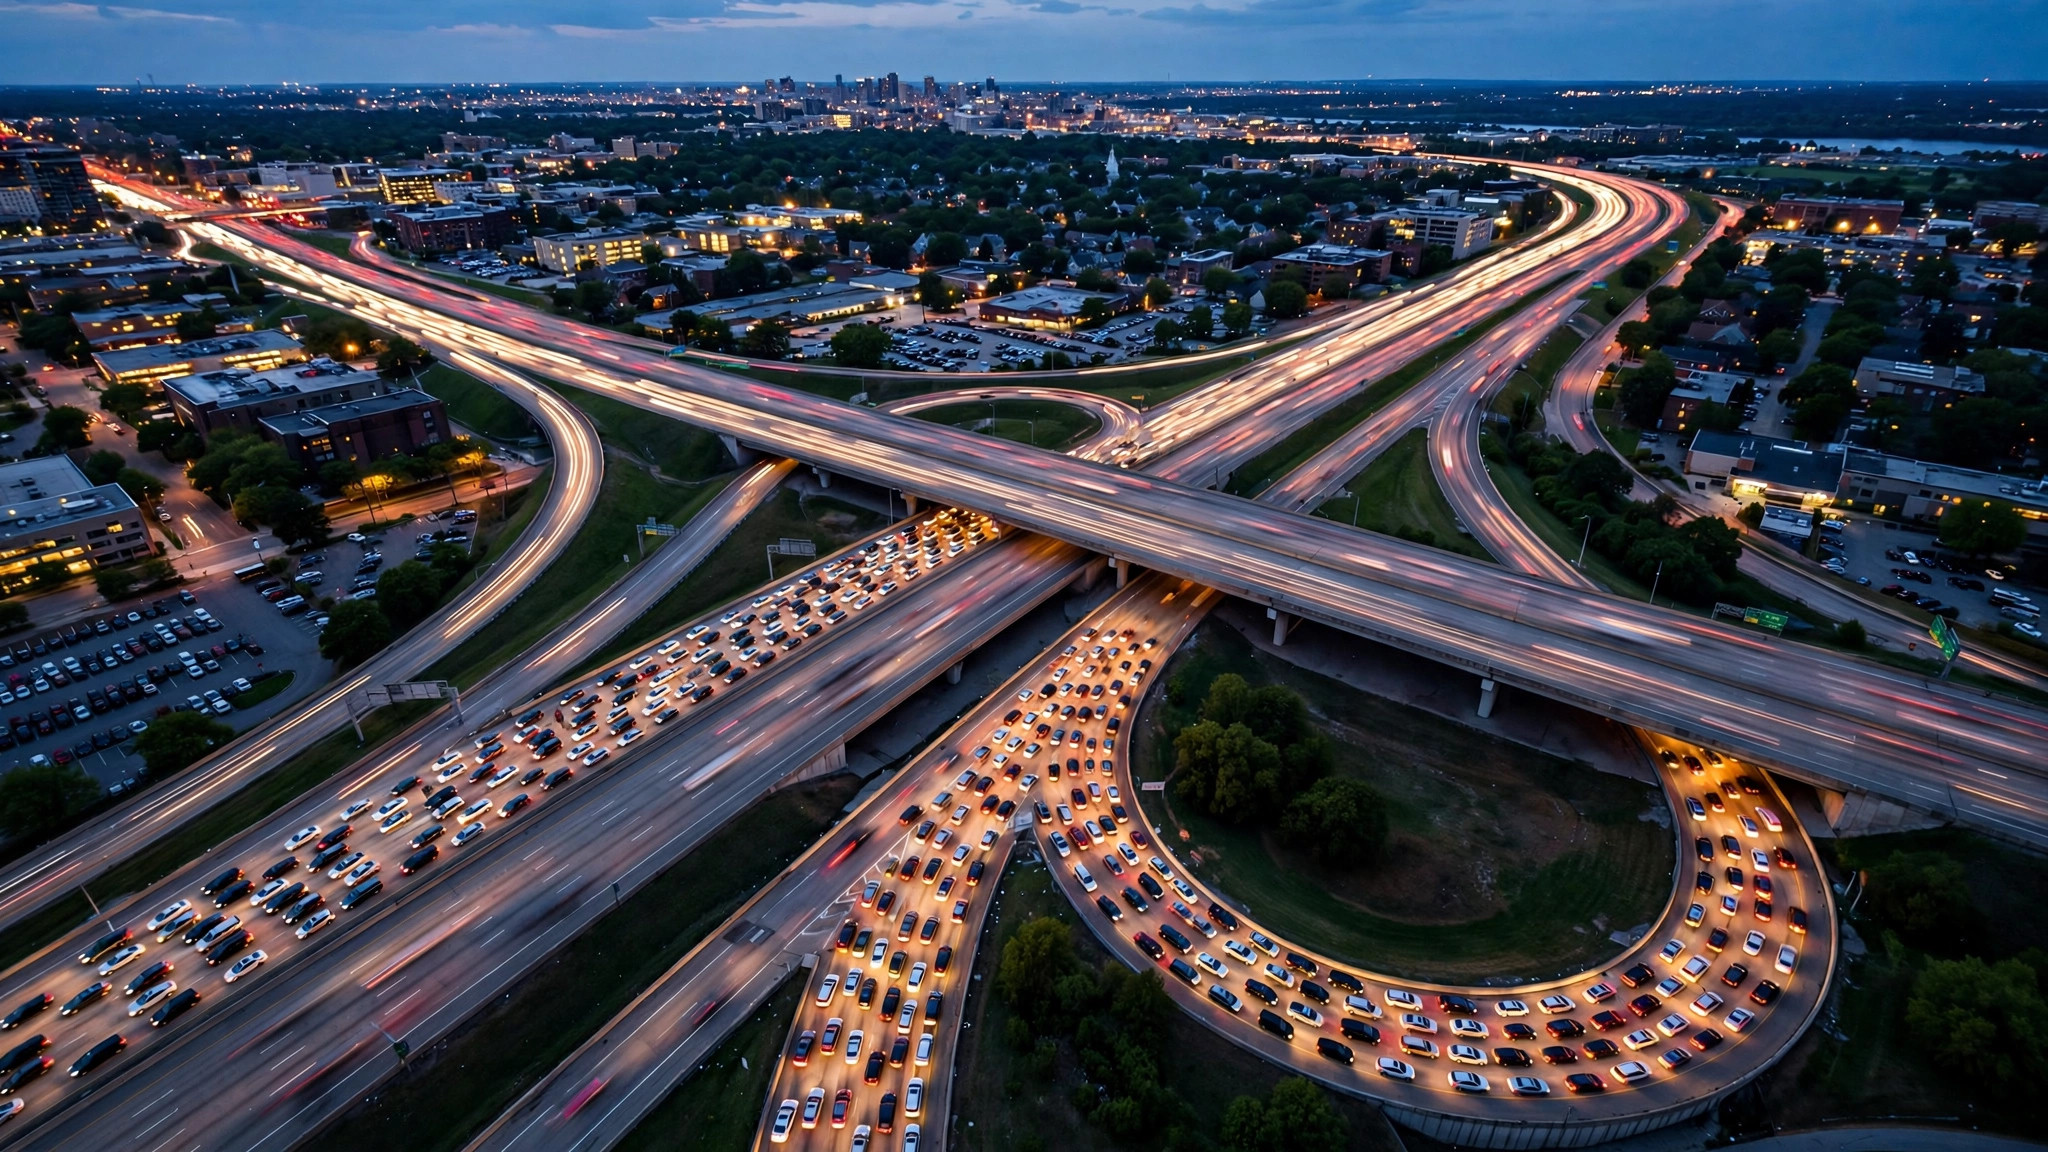
Before the engine starts, one glance at the map can rewrite your next hour. Google Maps paints the roads around you in green, orange, red and dark red — a live portrait of traffic near you built from the movement of thousands of phones — and learning to read that portrait fluently is the difference between driving through your city and being processed by it.
This guide covers the traffic layer properly: where the colours come from, what each one claims, how incident markers and closures refine the picture, and how the “typical traffic” view lets you preview a route’s future. It is the road-going sibling of our busyness guides — where those read crowds of people in places, this one reads crowds of vehicles on roads — and it pairs with our pillar overview of the Busy Area feature on Google Maps, which covers the map’s other live layer.
traffic close to me
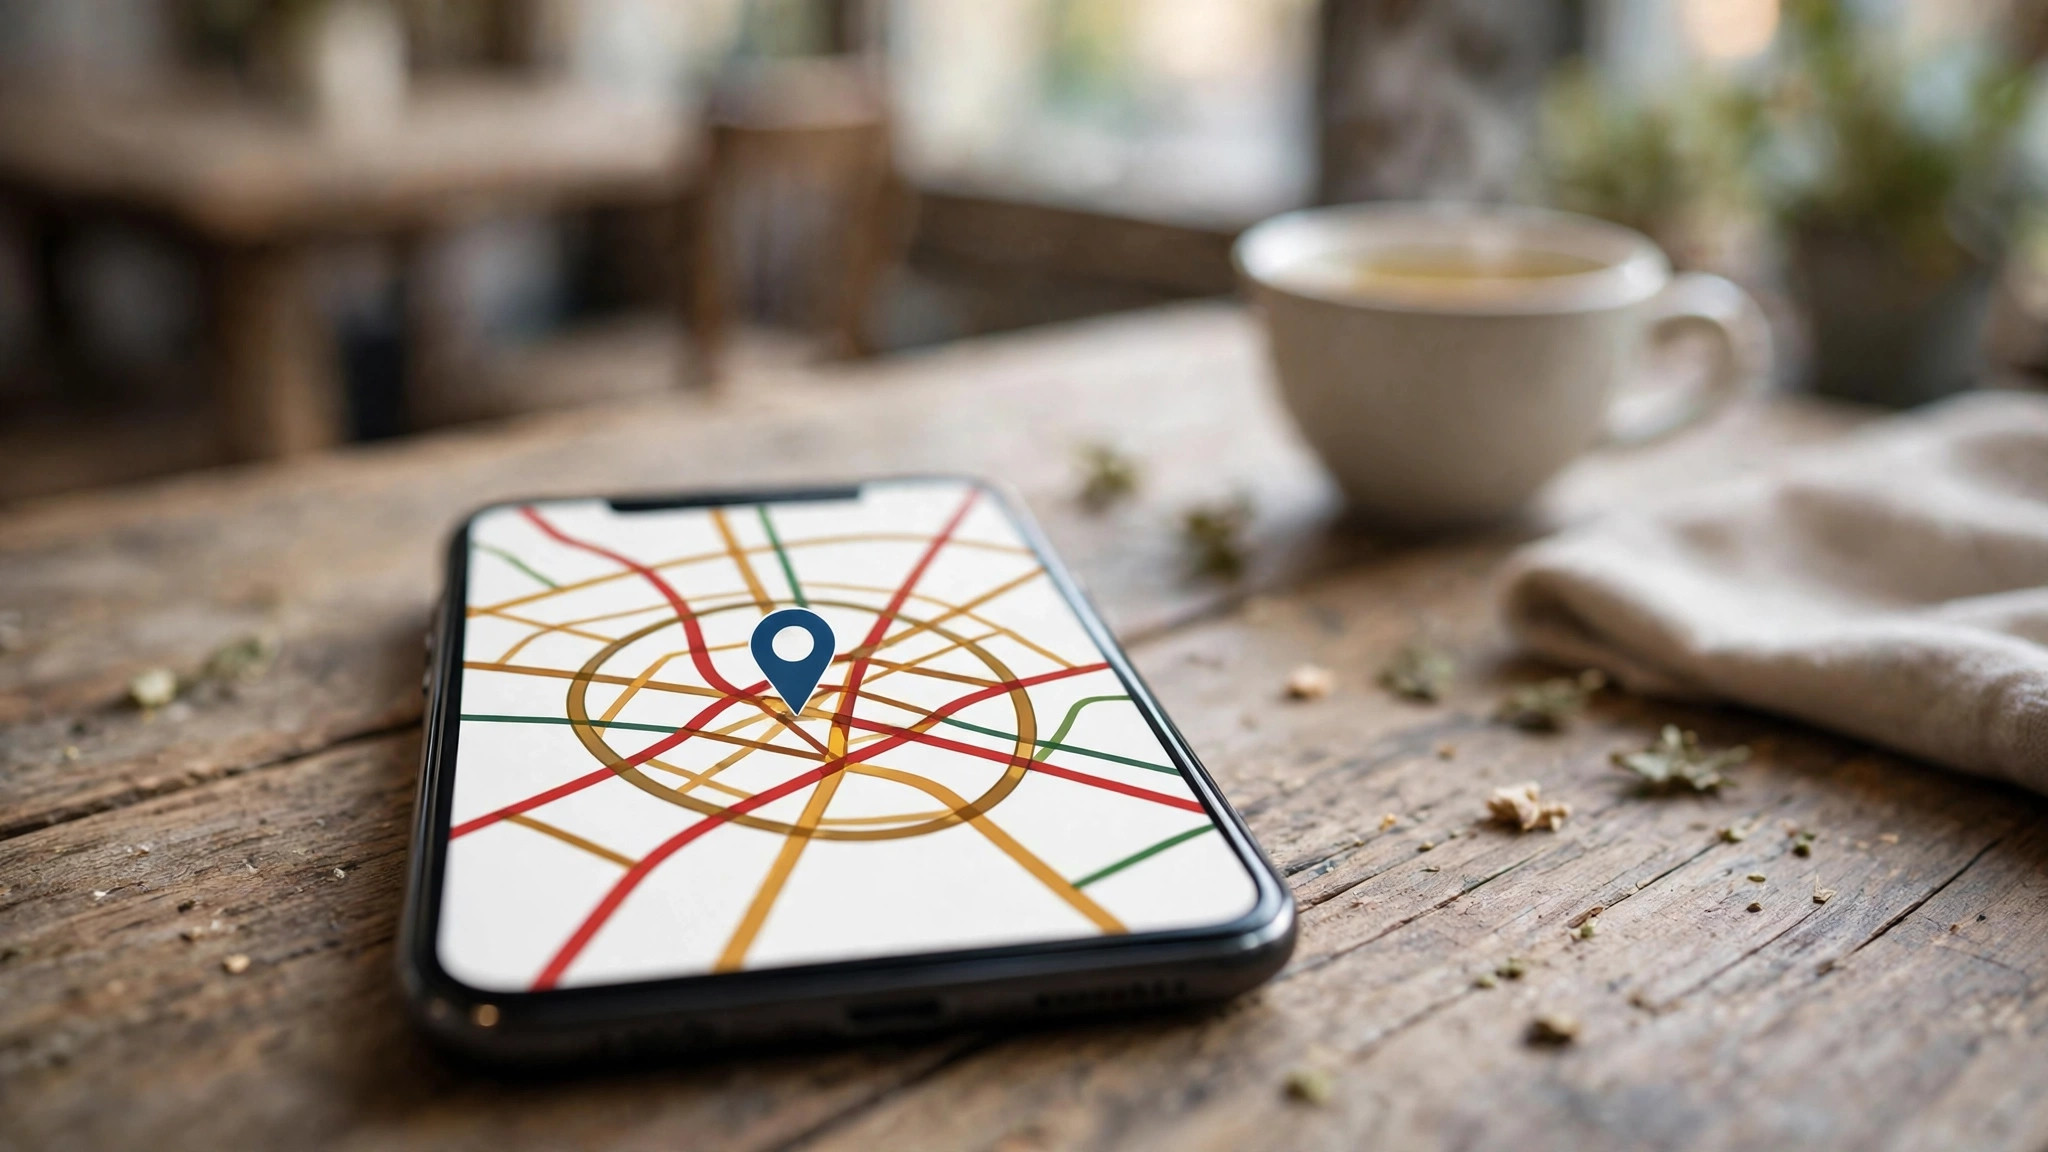
The traffic layer is switched on from the map’s layer control — the stacked-diamond icon — by choosing Traffic. Roads then carry coloured overlays wherever Google has enough live data: main arteries first, smaller streets where coverage allows. On a phone, the same layer is a tap away in the app; in navigation, it is simply always there, colouring your route and quietly re-routing you around the worst of it.
“Close to me” matters because traffic is hyperlocal. Conditions two kilometres away are another city’s news; conditions on your first three junctions decide your departure minute. Learn to open the map already zoomed to your corridor — home to office, home to station — rather than the whole city: the portrait that matters is the one along the roads you will actually touch, and the layer rewards a corridor view with faster, clearer reading than any city-wide survey.
Where no colour shows, read it correctly: the road is not certified empty — it may simply be a street Google cannot measure well. Absence of colour is absence of data, on minor roads especially, and the smaller the road the likelier the silence.
local traffic
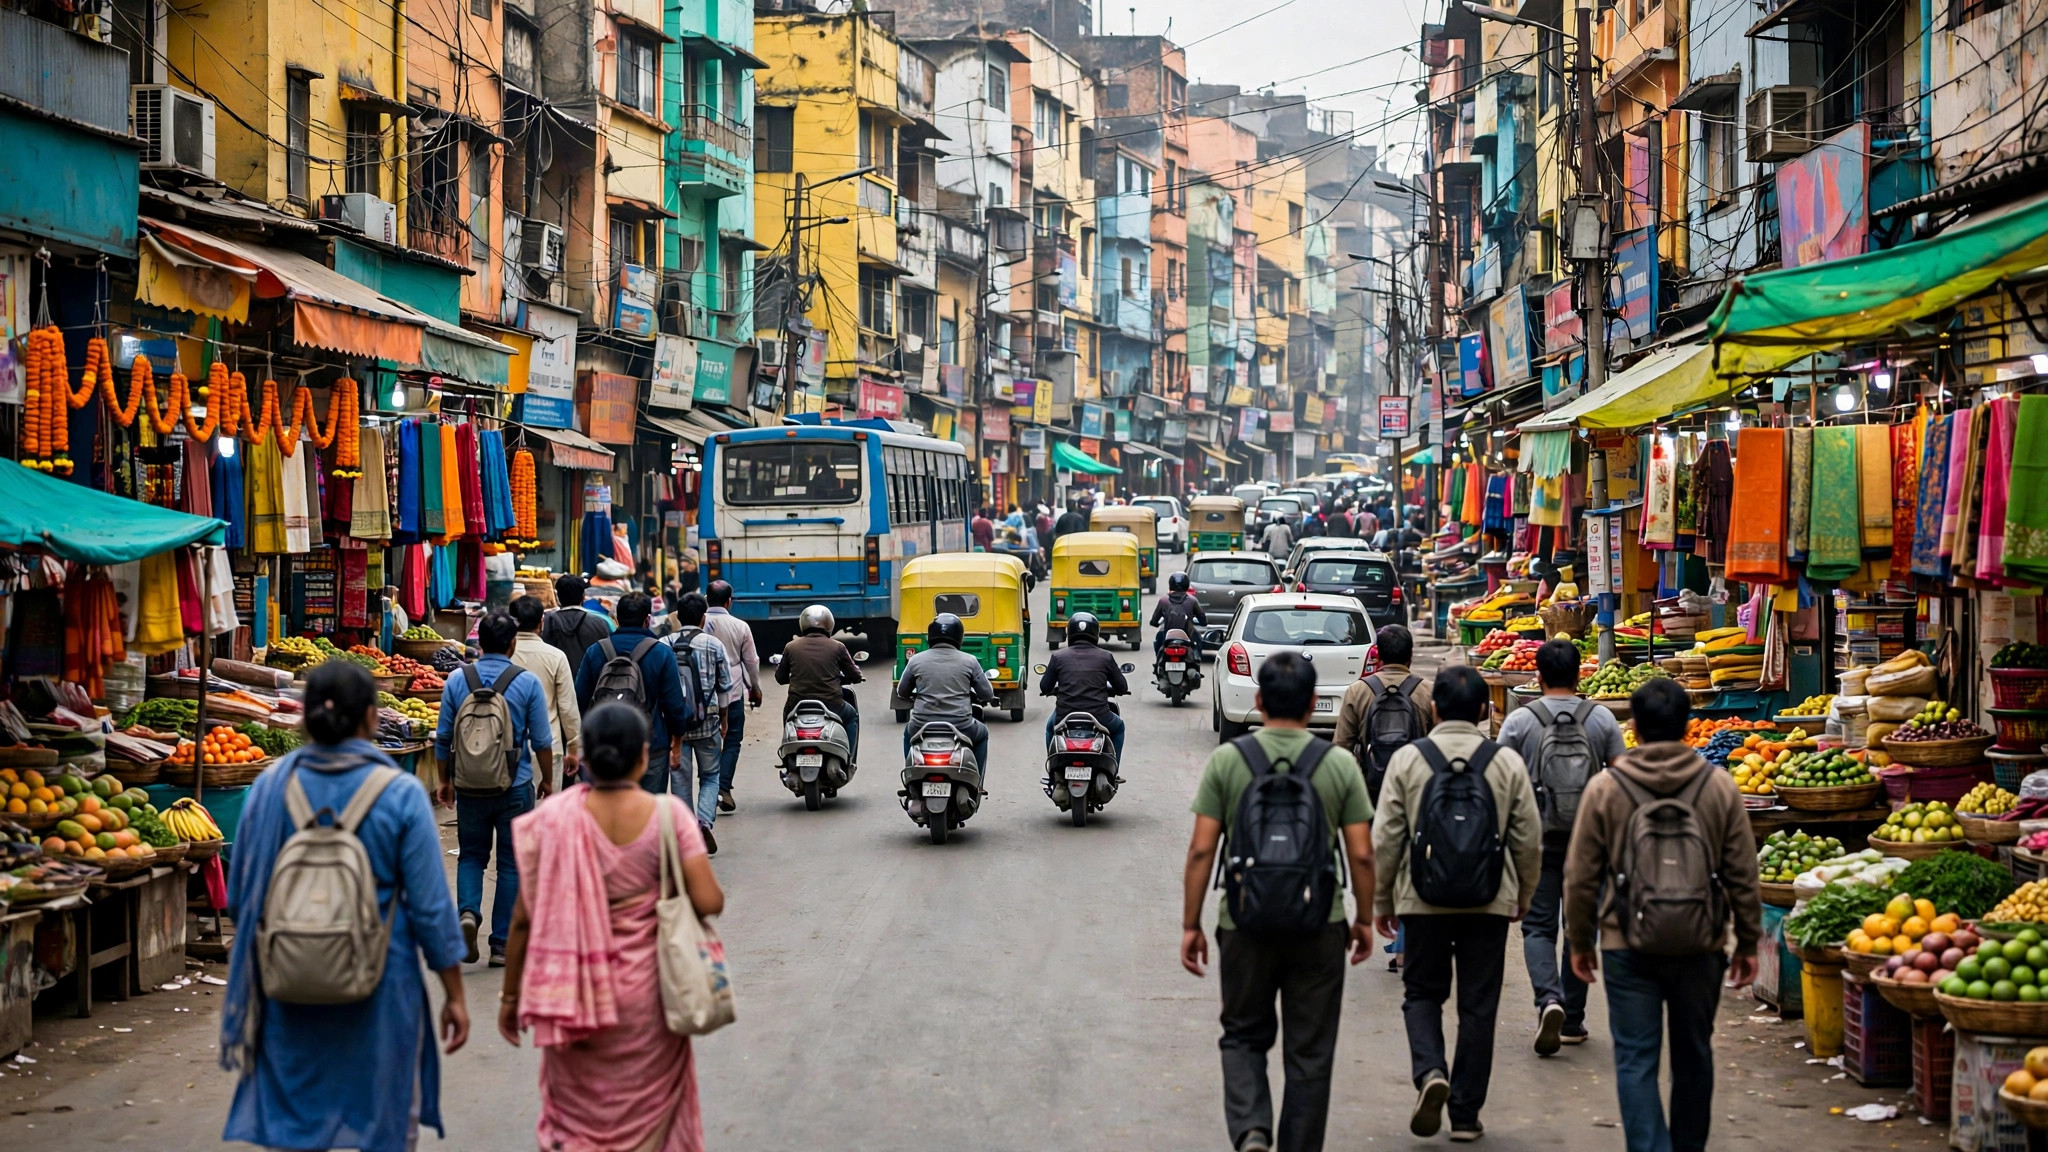
Local traffic has a rhythm so regular that residents recite it like scripture, and the layer’s first gift is confirming that rhythm with evidence. The morning build toward office and school districts, the strange calm of the early afternoon, the evening exodus, the weekend’s single midday hump aimed at markets and malls — all of it is drawn live, and all of it can be learned for your streets rather than traffic folklore in general.
That learning pays in micro-decisions no navigation app makes for you: which of two equal routes your neighbourhood’s school run poisons at 8 a.m.; which arterial the stadium empties onto; which bridge the rain slows first. A week of glancing at the layer before routine trips teaches you your locality’s traffic personality — its choke points, its release valves, its honest peak — and that personality, once known, quietly improves every departure you make afterwards.
Local knowledge also calibrates trust. When the layer and your experience disagree — a road coloured red that you know drains fast, a “clear” route past a school at closing time — believe the disagreement is information: something unusual is happening on the first, and something unmeasured (a crossing crowd, a parked bus) is happening on the second.
traffic status near me
The status of a road, in Maps’ vocabulary, is a speed judgement rendered in four colours:
- Green — traffic is moving at or near the road’s normal free speed. No delay worth planning around.
- Orange — slower than free flow; a building queue or a heavy stream. Add time; no heroics required.
- Red — congestion: speeds well below normal, stop-start likely. This is the colour that eats schedules.
- Dark red — severe congestion, near-standstill. Treat the road as temporarily removed from your network and route around it if the map offers any alternative at all.
Two refinements keep the reading honest. The colours are relative to the road’s own normal, not absolute speeds — orange on a motorway may still be faster than green on a lane. And they describe the road now, computed from vehicles currently on it: a status is a measurement of the recent minutes, ageing as you watch, which is why the final check belongs as close to departure as possible — the same live-versus-typical discipline we teach for crowds in our guide to where Google’s busy data comes from, whose anonymised-signal pipeline has a road-going twin in the system described in the Google Traffic overview on Wikipedia.
traffic conditions near me
Colour is the headline; conditions are the article. Layered on the colours, Maps marks the causes: incident icons for accidents and breakdowns, roadwork symbols, and closures drawn as dashed or blocked segments. Reading causes converts a vague “bad traffic” into a decision — an accident two junctions ahead argues for an immediate detour, while roadworks that have been red for a week argue for a permanently different route.
Conditions also include what the weather is doing to the network, visible only in aggregate: the first heavy rain of the season reddens a whole city’s map within twenty minutes, a fog morning slows the ring roads first, a festival procession carves a moving closure through its route. The layer will not name these causes, but their signatures — everything red at once, one corridor red in a line — become legible with practice, and legibility is the whole skill.
While navigating, conditions arrive as voice and banner alerts with re-route offers and revised arrival times. Accept the machine’s arithmetic in the moment; it is reading more of the network than your windscreen shows you.
traffic near me now
“Now” is the layer’s native tense, and using it well is mostly a matter of timing your glance. Check too early — an hour before departure — and you are reading a rush that may build or break before you join it. Check at the door, coat on, and the colours describe the network you are about to enter with fair accuracy for the next stretch of the trip. For long journeys, the honest method is rolling: the app re-reads conditions continuously en route, so the “now” that matters updates itself as you drive.
There is one more “now” worth cultivating: the now of your destination’s streets. The last kilometre — the market lane, the hospital approach, the stadium spill — is where journeys quietly lose their final fifteen minutes, and a destination-side glance before leaving tells you whether to plan a drop-off short of the scrum. Pair that with the departure-timing routine in our companion guide to how’s the traffic and the trip is read end to end before it begins.
live traffic status
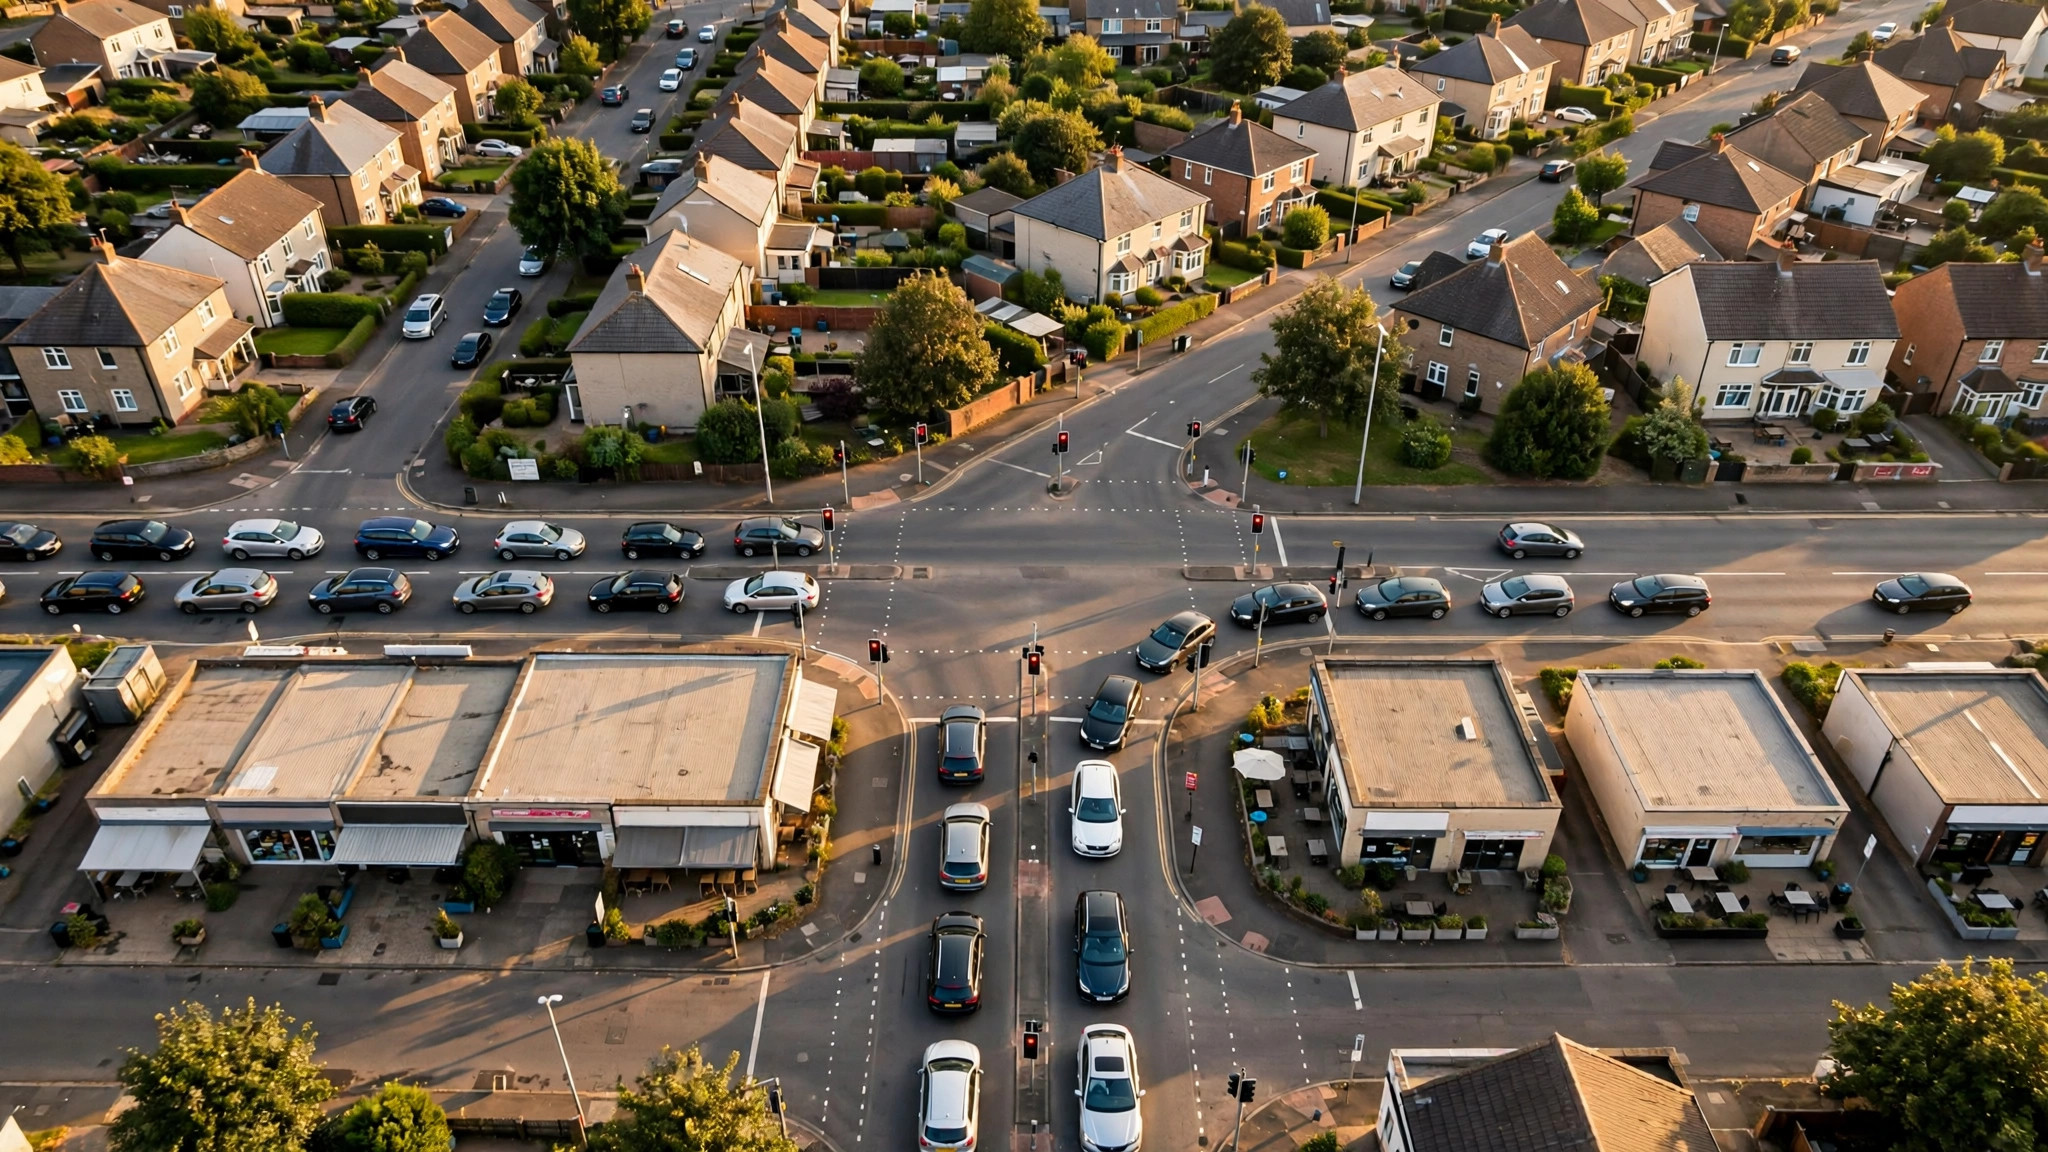
Live status earns its name from its sources: anonymised speed and movement signals from phones travelling the roads, refreshed continuously, supplemented by incident reports and official closure feeds where available. Its accuracy profile mirrors the crowd data’s: superb on major roads in busy hours, thinner on minor streets and at 3 a.m., and always a sample rather than a census — a lone slow vehicle (a learner, a delivery van stopping often) can tint a small road it has no business tinting, an artifact the system filters at scale but not to perfection.
Its other limit is prophecy. Live status is a photograph, not a forecast; the map’s answer to “what will it be like when I get there?” is the typical traffic view — historical patterns for a chosen day and departure time — which is the correct tool for planning tomorrow’s airport run. Live for the trip you are taking, typical for the trip you are planning: that division, respected, makes both instruments honest.
traffic maps
The traffic map, assembled, is best treated as a household instrument rather than a driver’s gadget. The school-run parent, the airport-run sibling, the delivery rider and the office commuter in one home are all reading the same portrait for different journeys, and the household that glances habitually — map on the kitchen counter’s phone, colours checked with the tea — schedules itself measurably better than the one that discovers congestion from inside it.
Keep the map’s place in the toolkit proportionate, though. It reads the network’s present superbly and its future statistically; it cannot see the procession that starts in twenty minutes or the signal failure that has not happened yet. Combine it with local knowledge and the day’s news, and the four colours become what they were designed to be: not an oracle, but the best-informed departure decision you have ever been able to make from your own doorway.
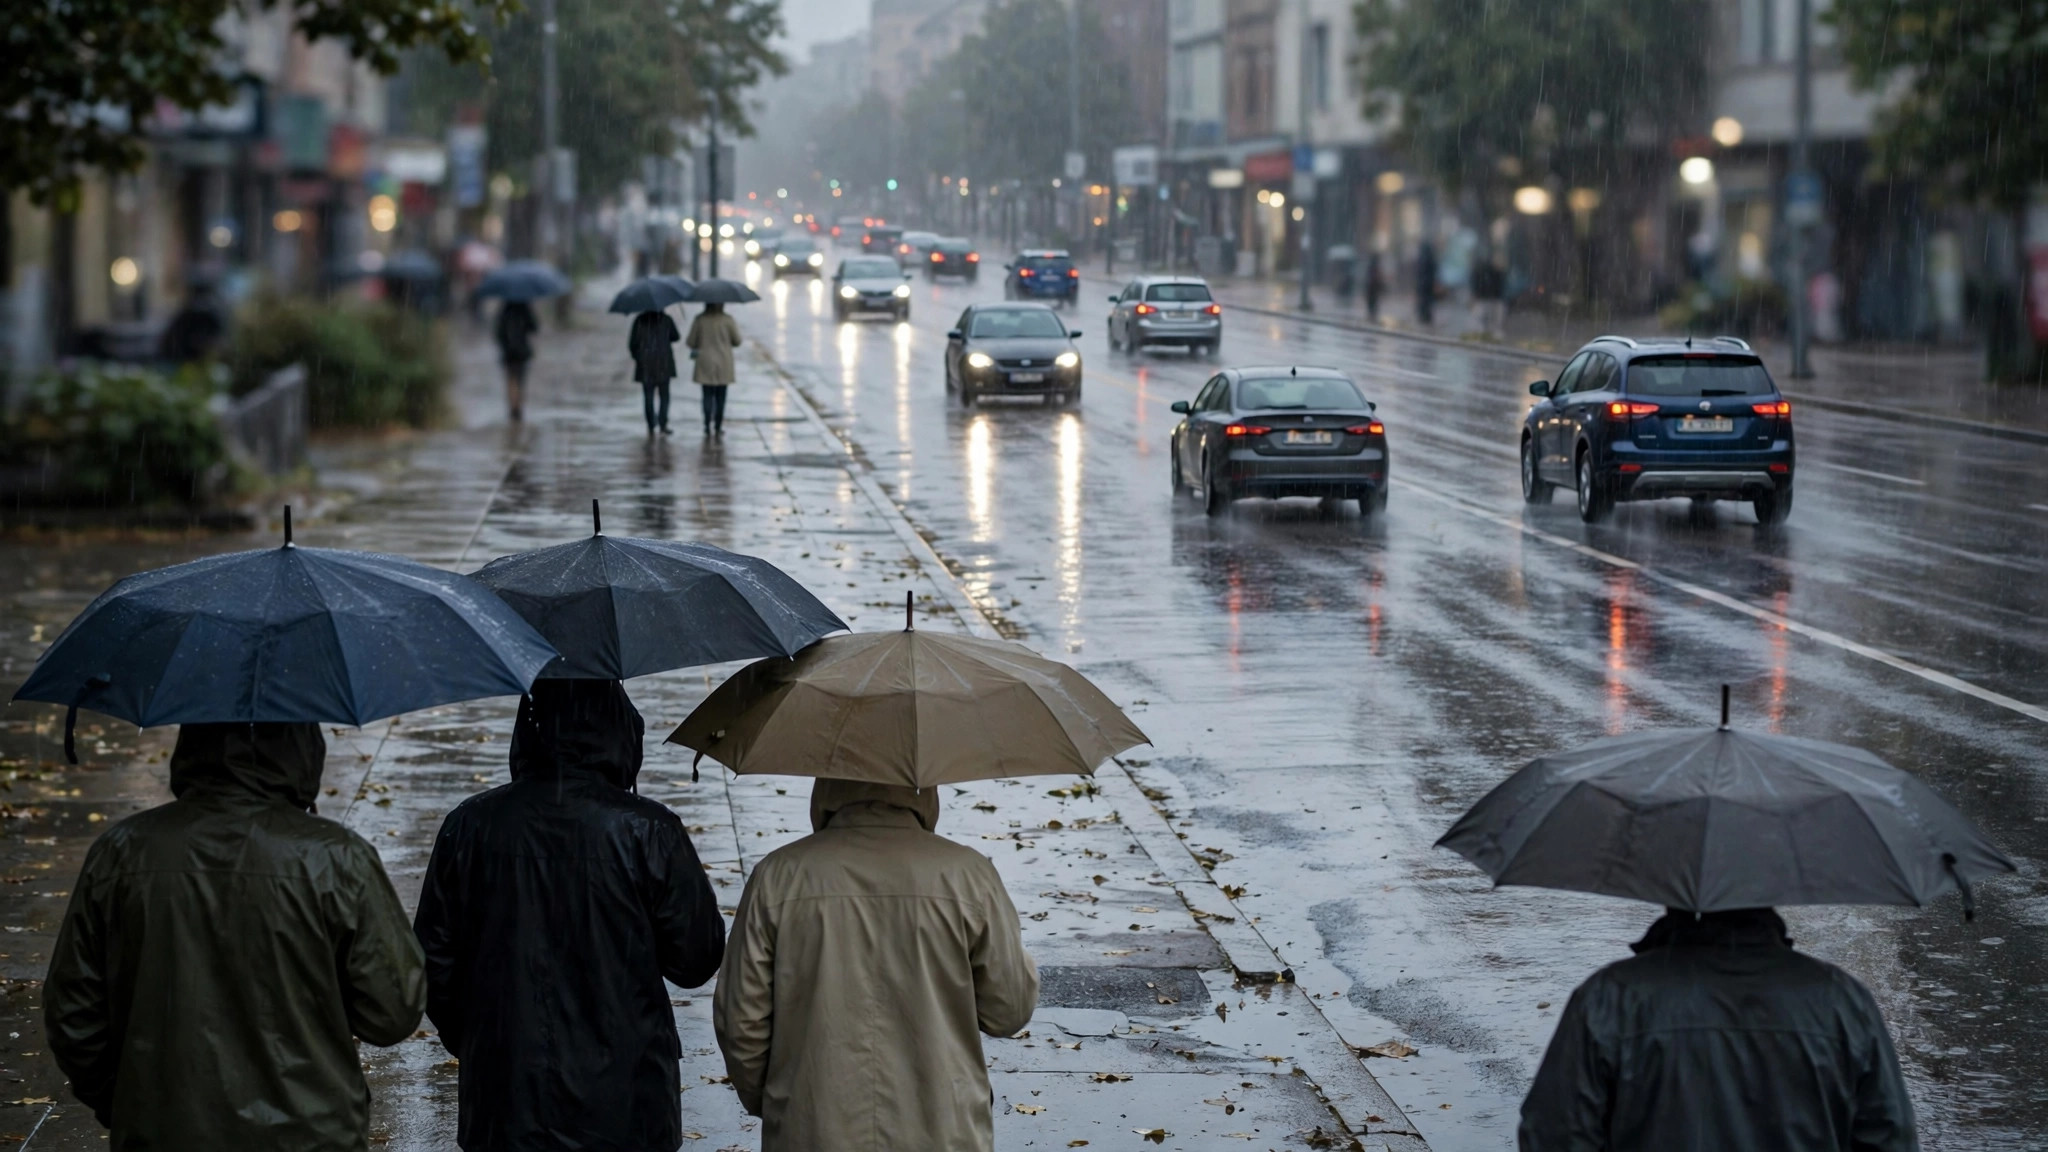
One map, two weathers: traffic and crowds together
The traffic layer does not live alone on the map, and its most sophisticated readers run it alongside the crowd layer this site usually covers. The two weathers interact predictably: a district wearing its Busy Area outline will, within the hour, redden the roads that feed it; a stadium emptying at full time appears first as a place event and then as a traffic one, the red draining outward along the arterials like a tide going out. School terms change both maps together; the first monsoon evening rewrites both within the hour.
The practical dividend is anticipation. A destination-side glance that shows the market district’s outline already glowing at 5 p.m. tells the driver what the traffic layer will say at 5:40 — and lets the departure move earlier, the route change sides of the district, or the plan simply absorb the knowledge calmly. Two live layers, read as one system, turn the map from a reporter of the present into something close to a forecaster of the next hour — the closest thing to a weather service for city movement that has ever been given away free.
Frequently asked questions
What is the fastest way to check traffic near me before leaving?
Open your route in Maps with the traffic layer on, read the current journey estimate against the time the same trip takes on a calm day, and locate any red on your corridor. Thirty seconds is enough; the full routine is in the sections above.
Why is a road I can see is jammed showing green?
Either the jam is very new — live data lags by minutes — or the road is minor and thinly measured, so its colour rests on very few signals. Trust your eyes for that road; trust the map for the network beyond your view.
Do the colours account for traffic lights and tolls?
Indirectly: they reflect measured speeds, which already include the delays signals and tolls cause on that road at that hour. Recurring toll-plaza queues appear as recurring red, correctly.
Is live traffic available in small towns?
On main roads, usually yes; on minor streets, coverage thins with the number of phones travelling them. Highways between towns are generally well covered even where the towns themselves are patchy.
