
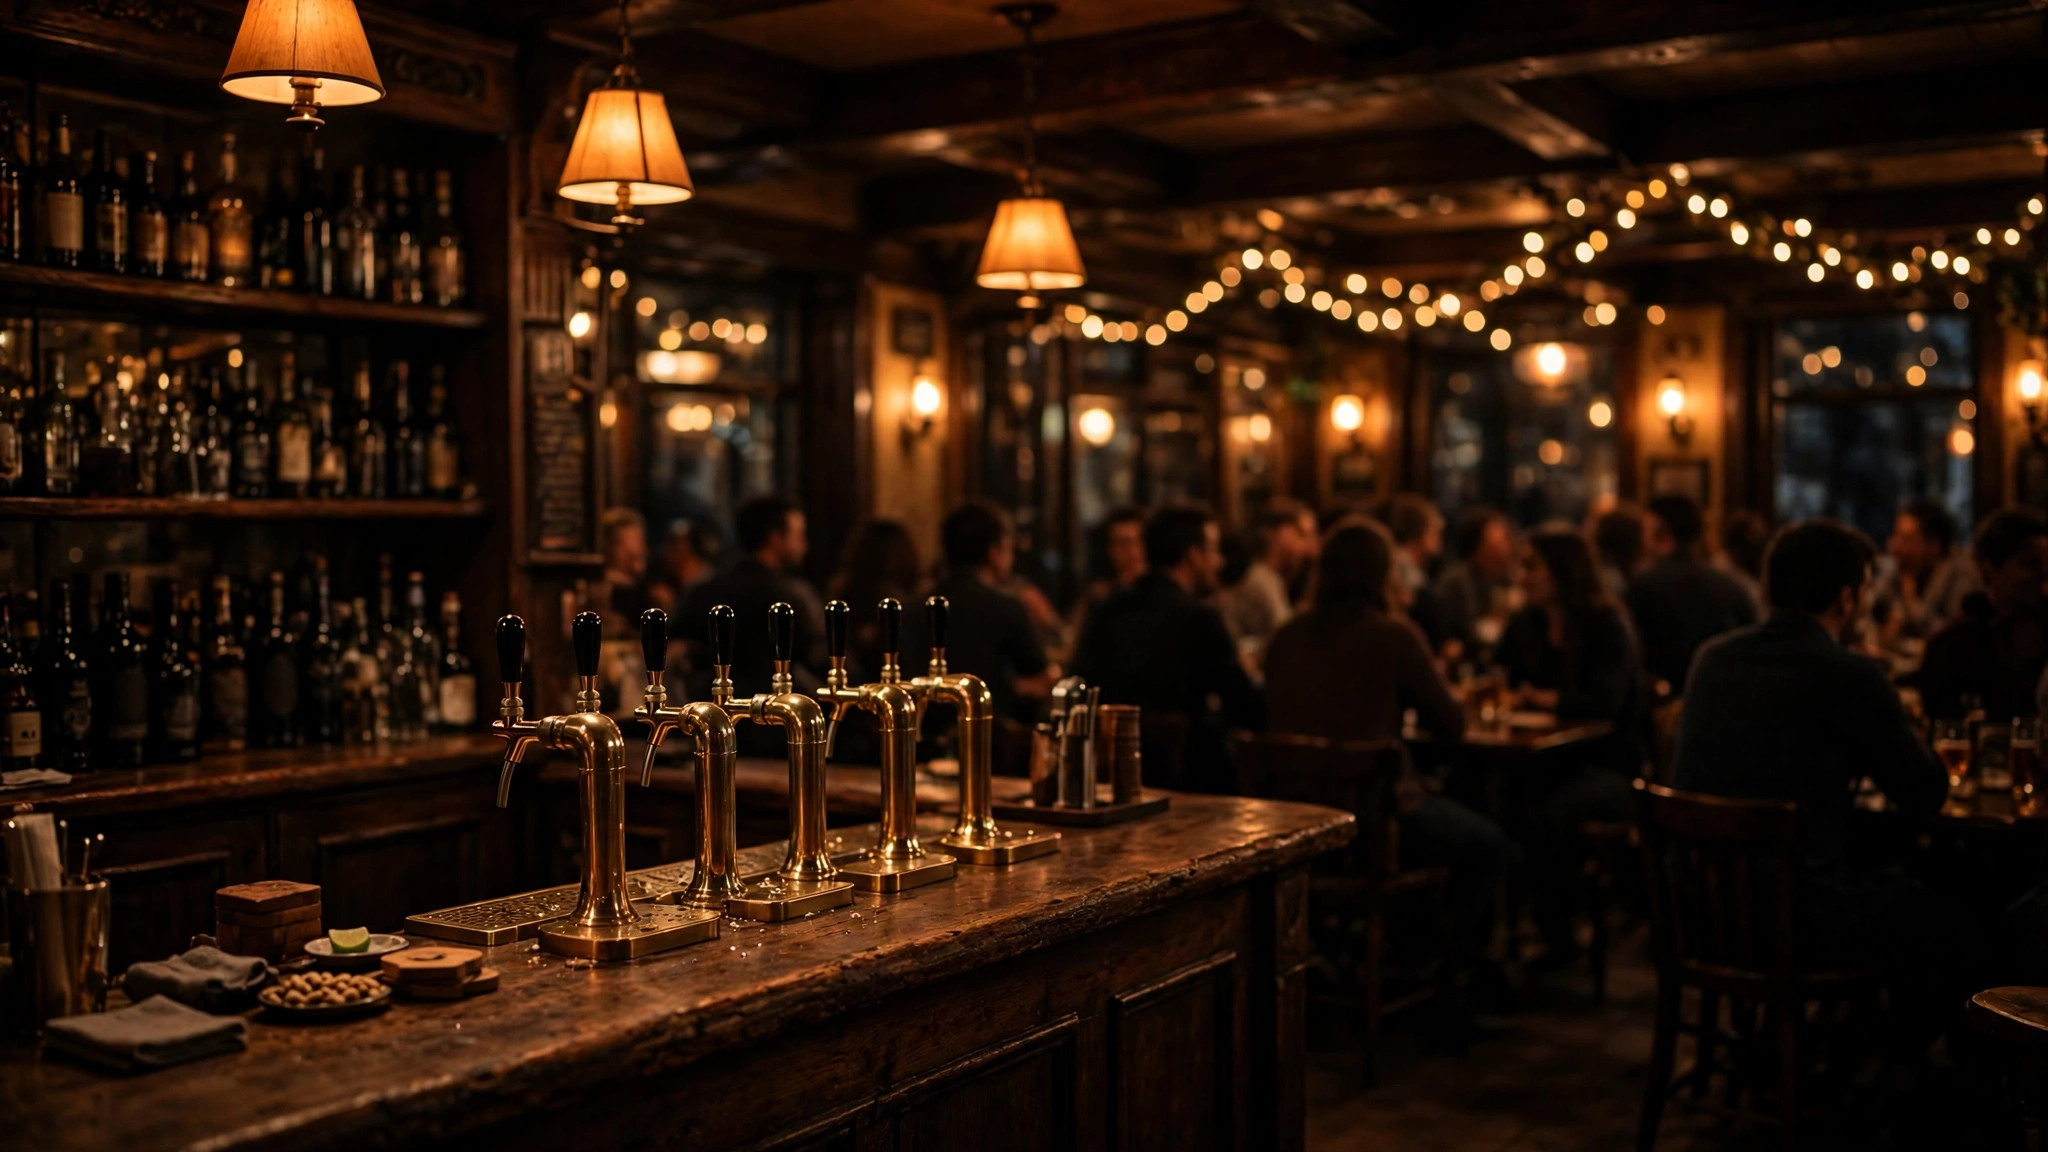
Every pub has a heartbeat, and it beats loudest on Friday night. Bars and pubs busiest nights are no mystery to regulars — Friday and Saturday dominate, happy hour bends the weekday curve, and match days rewrite it entirely — but the details vary enough by venue that Google Maps’ Popular Times graph is worth reading before you plan a round. A city cocktail bar, a sports pub and a village local each keep a different week, and the graph knows which is which.
This guide maps the weekly rhythm of bars and pubs: the happy-hour surge, the Friday build, the Saturday maximum, the sporting surges and the quiet nights that regulars keep to themselves. Treat the patterns as typical — your venue’s own listing, and its events calendar, have the final word.
Bars and pubs busiest nights: the week in five movements
Monday and Tuesday are the industry’s quiet nights. Many bars run reduced hours or close entirely; those that open serve regulars, darts and pool teams, and the hospitality workforce on its night off. If you want a conversation at the bar and the bartender’s full attention, this is your window — the same drink, a different room.
Wednesday is the hinge. Student nights in university towns, quiz nights in locals, and the general midweek loosening lift Wednesday well above the Monday–Tuesday floor. In student areas Wednesday can outdraw Friday.
Thursday is the new Friday in many city centres: after-work drinks that do not quite end, office parties, and the first big night of the weekend economy. City bars often run their week’s second-highest bars on Thursday.
Friday is the classic peak. It starts early — the after-work surge from about 5 PM — and builds in layers: work crowds, then dinner-adjacent drinkers, then the late crowd, cresting between 9 PM and midnight. Saturday matches or beats it, starting later, peaking later, and lasting longest. Saturday is usually the single busiest night on a pub’s graph, with the maximum typically landing between 9 PM and 11 PM.
Happy hour: the manufactured peak
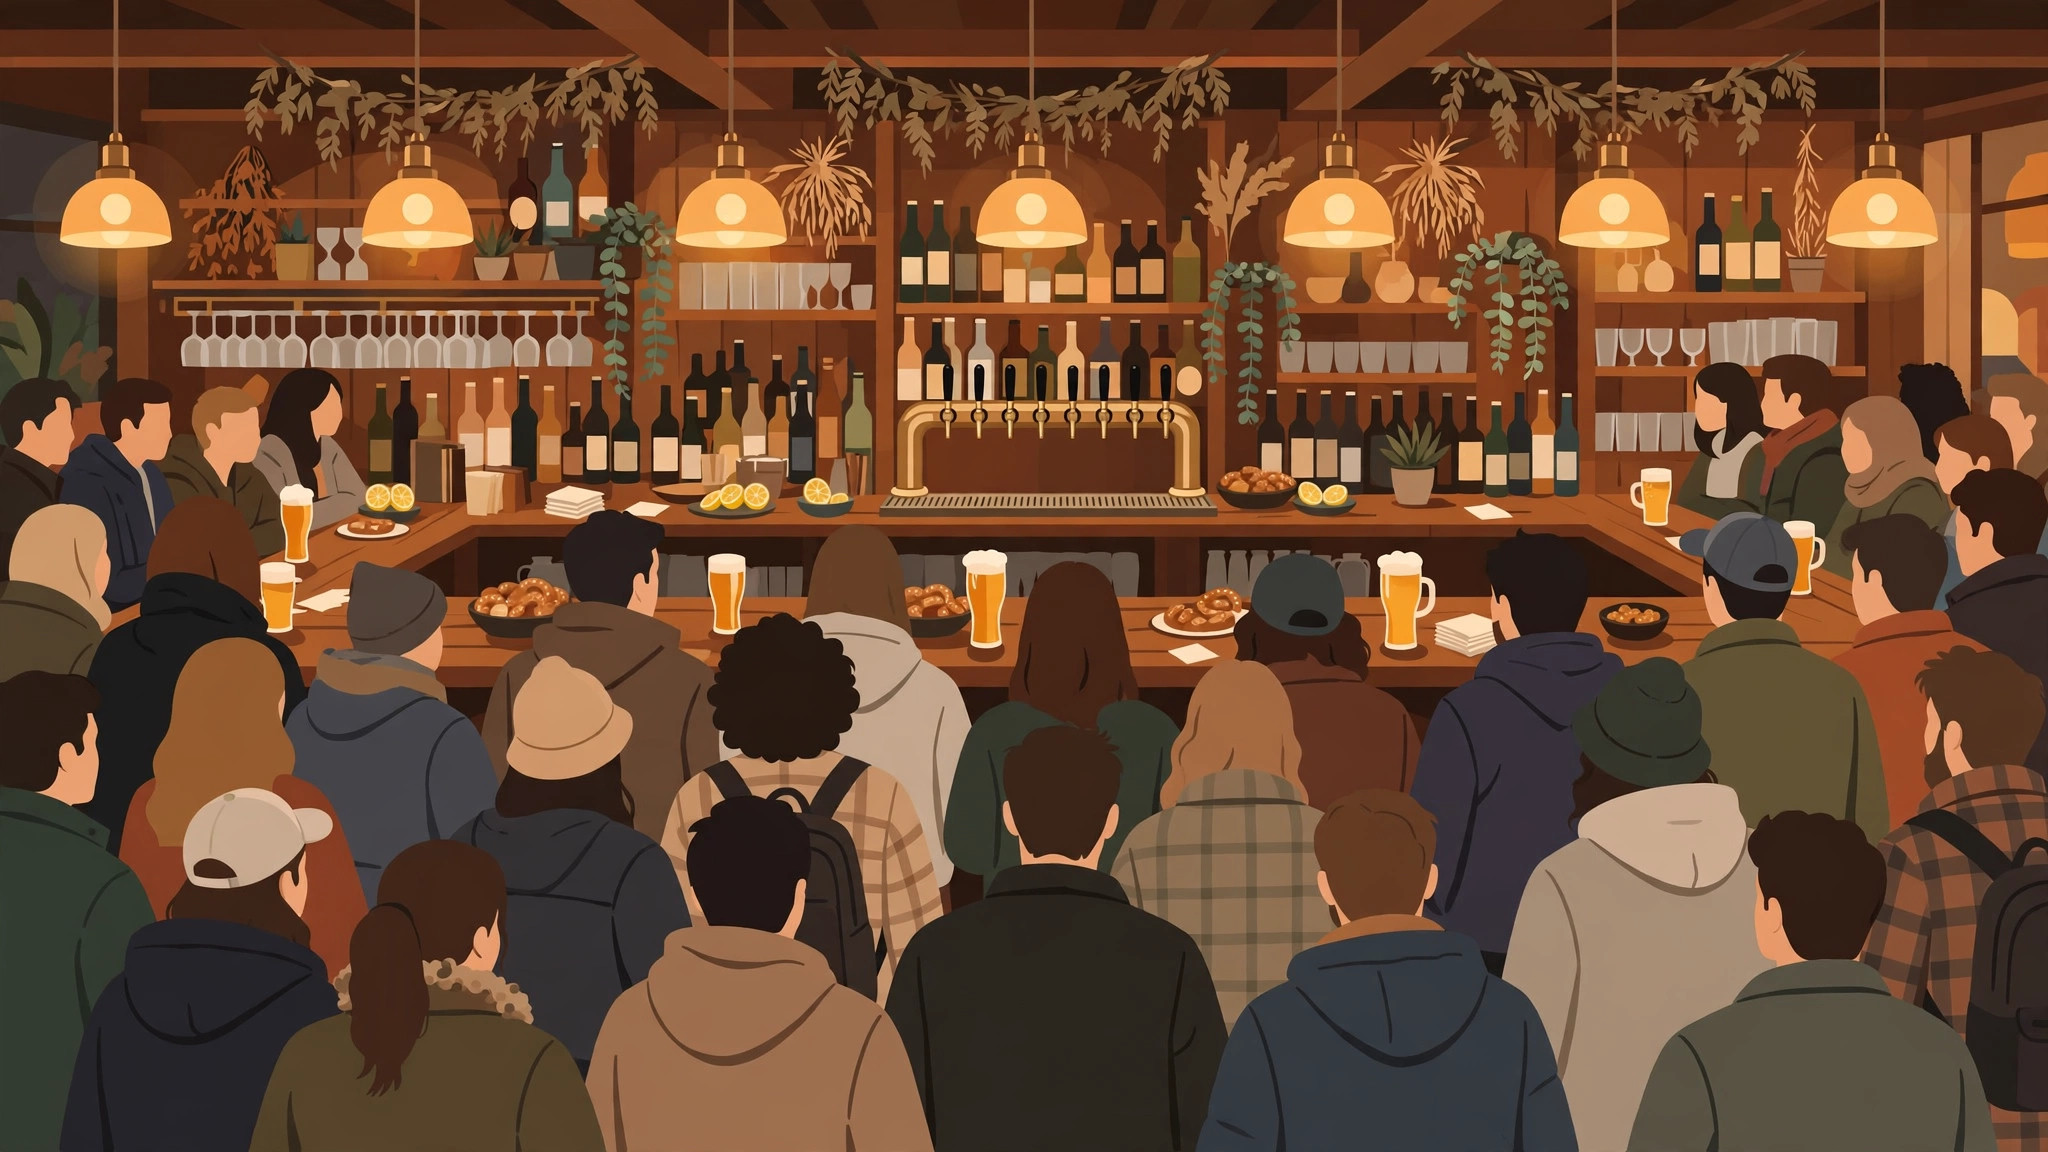
Happy hour exists to pull the evening peak earlier, and on the graph it works: a visible surge in the 5 PM–7 PM window on weekdays, steepest on Thursdays and Fridays. Two consequences for drinkers. First, the discounted window is often not the quiet window — at popular bars it is the first crush of the night, and the calm comes after it ends, when the happy-hour crowd moves on to dinner and the late crowd has not yet arrived. Second, venues stagger.
If your first-choice bar’s happy hour packs out at 5:30 PM, a neighbouring bar whose deals run later may be at its calmest then. Comparing the live bars of two or three venues on the same street — all visible in one Maps search — is a genuine pub-crawl skill. The district context behind those comparisons, the shaded busy-area signal, is explained in our Busy Area pillar guide.
Match days, quizzes and the event calendar
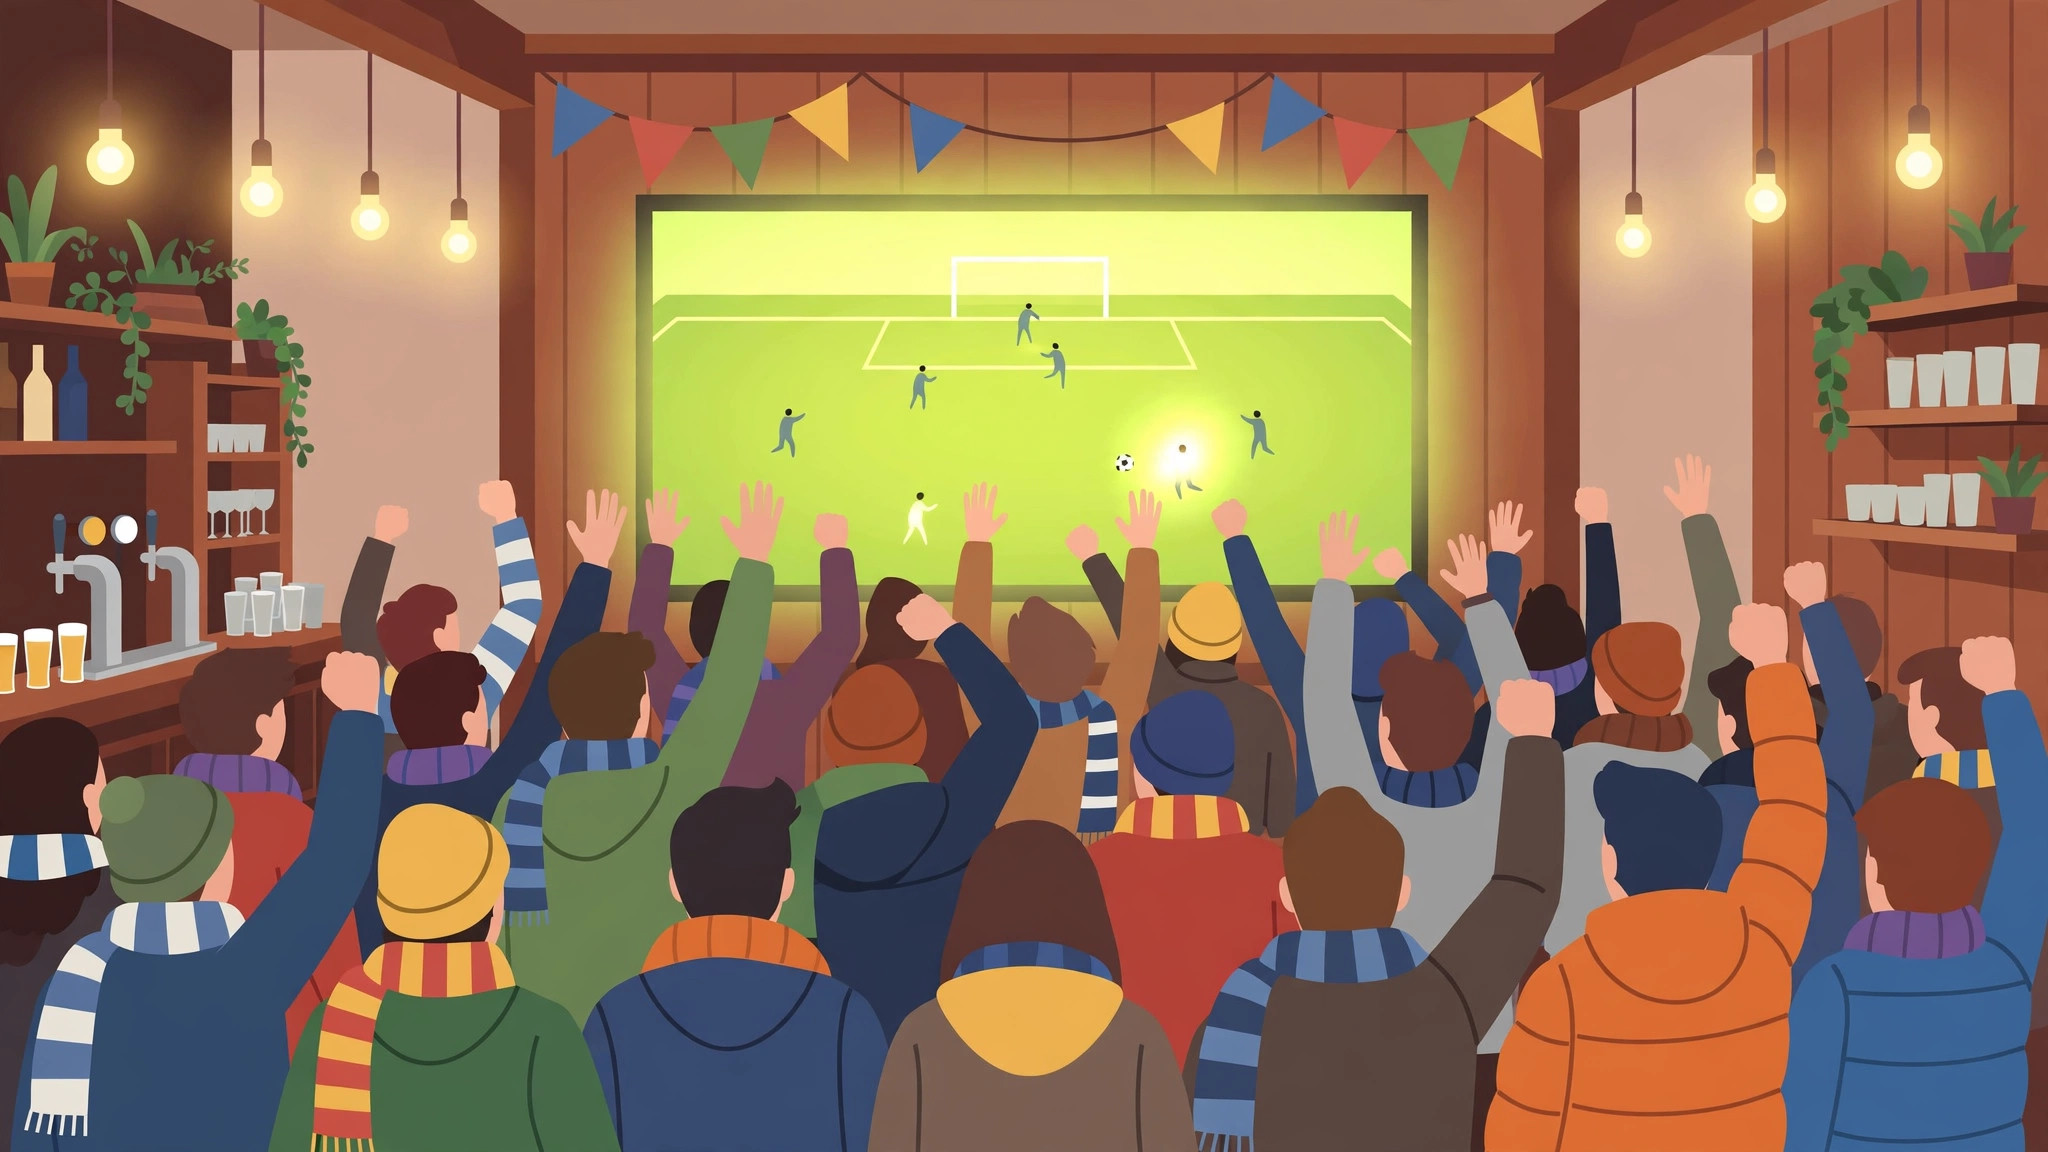
Sport bends the pub week more than any other force. A televised match involving a popular team can turn a Tuesday into a Saturday: the crowd arrives an hour before kick-off, peaks at the match itself, and empties within half an hour of the final whistle — unless the result sends them celebrating. Pubs near stadiums run the sharpest version: a pre-match build, a strange lull during the game itself if they are not showing it (or a lock-in peak if they are), and a post-match surge.
Quizzes, live music, karaoke and comedy nights create smaller, dependable weekly peaks, usually on the quiet nights — that is their purpose. A pub’s graph averages these in, so a Tuesday bar that looks oddly high on the graph often has a Tuesday event; the venue’s social pages will tell you which. Seasonal events — New Year’s Eve, St Patrick’s Day, Halloween, the local festival weekend — sit above the graph entirely: on those nights, typical patterns are a floor, not a forecast. For how this event layer interacts with the dinner crowd in the same district, see our companion playbook on the restaurant busy problem and how to skip its queues — the two crowds share streets, kitchens and closing times.
Reading a bar’s graph like a regular
Bars have one data quirk: visits are long. The typical visit duration at a pub can run to two or three hours, so the graph’s peak reflects accumulation — everyone who arrived since early evening still being there — more than arrivals. A 9 PM “as busy as it gets” may mean the room filled at 7 PM and simply stayed full. Arriving at the graph’s rising edge matters more than arriving before its peak.
Live busyness helps most early in the evening, when tonight’s shape is still deciding itself. By the time a Saturday is at maximum, no app is needed to know. Also note the graph’s closing-time behaviour: many listings show the peak sliding as licensing hours approach, and the truly busy moment at a late bar may be the hour before close — a pattern worth knowing if your night is just starting when the graph says the venue is winding down.
City-centre bar districts also move as a unit: when the whole area glows busy on the map — the same district effect we map for mall food courts and shopping districts — every venue in it is full together, and your best move is a local outside the district rather than a different bar inside it. Google sets out how it builds these area and venue signals from anonymised visits in its Google Maps Help pages.
The quiet windows worth knowing
Every busy venue keeps a few hours the crowd has not discovered, and they differ by venue type:
- The sports pub on a match-free weekday evening — all the screens, none of the crowd; the room is yours.
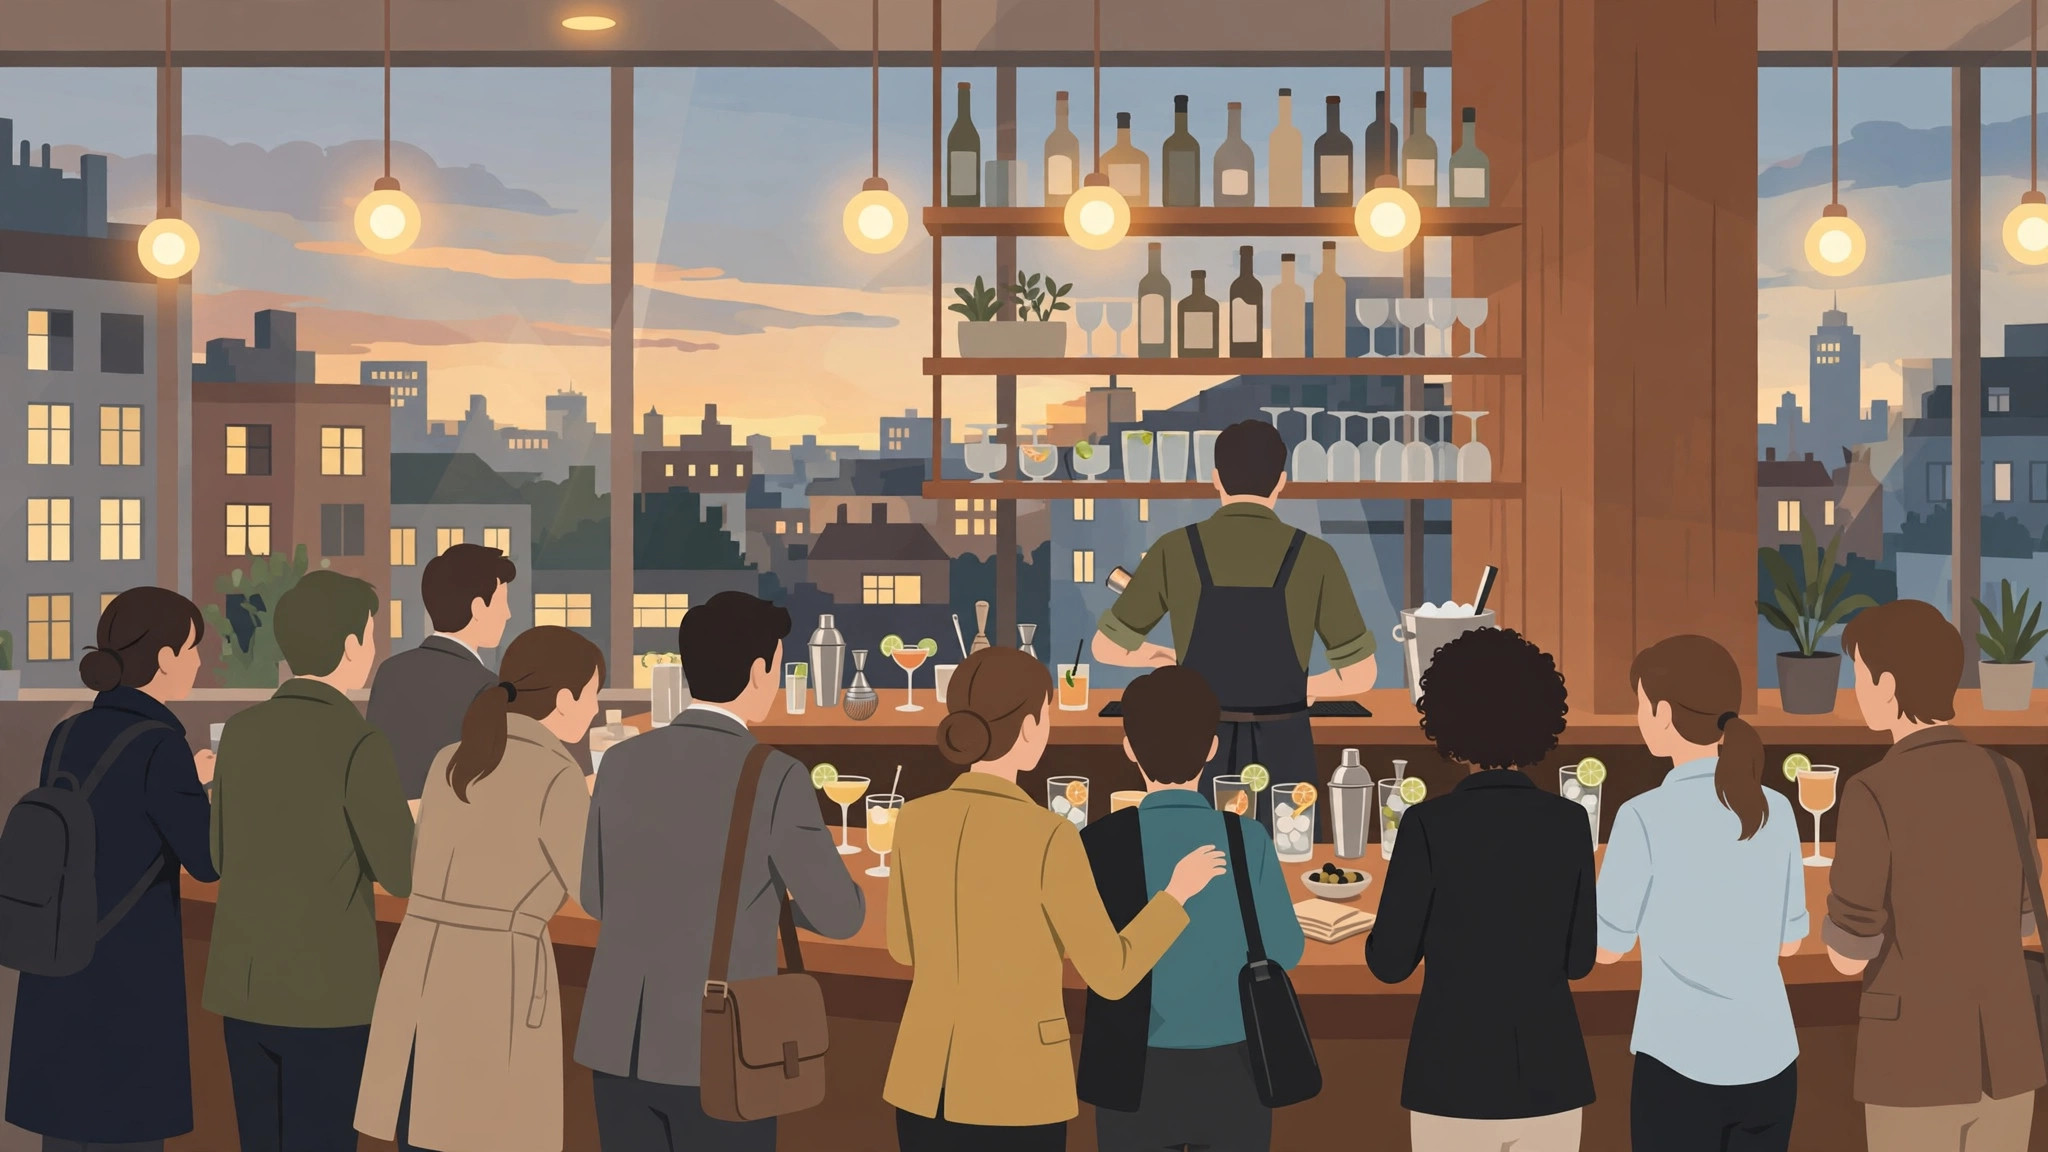
- The cocktail bar before 7 PM — the skilled staff, the full menu, and seats at the bar itself rather than a standing spot three deep.
- The village local on a Sunday evening — the week’s soft landing: a fire, the regulars, and no queue for the bar at all.
- The city bar in the hour after happy hour — the deal crowd has left for dinner, the late crowd has not arrived, and the room breathes.
- Any pub in the first week of January — the year’s quietest trading days outside of closures, when the whole district is recovering.
The way to find your own venue’s version is the graph plus one experiment: pick its lowest bar on a night you can go, visit once, and see whether the data told the truth. One confirmed quiet window is worth a year of guessing, because venue rhythms are stable — the same quiz, the same crowd, the same peak, week after week.
Getting home: the peak nobody graphs
A final busyness pattern surrounds the busiest nights rather than sitting inside them. When a district’s bars close together, the street, the taxi rank and the last trains inherit the crowd all at once — the closing-time surge. It peaks in the half hour after closing and can be the hardest part of the night to navigate. Venues with staggered closing times soften it; districts where everywhere shuts at once sharpen it.
The counter-moves are simple and rarely taken: leave twenty minutes before close and the surge has not formed; stay for a genuinely late venue and it has passed; or walk two streets out of the district before ordering a car, where the same ride arrives in half the time. Your night out is bounded by two crowds — the one in the bar and the one at the kerb — and the second is entirely optional.
Match days, quiz nights and the event calendar
A pub’s week is punctuated by events that override the standard curve. Televised sport is the biggest: a major match pulls the crowd in an hour before kick-off and holds it past the final whistle, and the graph for that evening — an average of ordinary weeks — will not warn you. Quiz nights, live music and darts leagues create smaller, regular spikes that regulars know and the graph partially learns, since they recur weekly. The way to read a pub, then, is the graph for the baseline and the fixture list for the truth: check what is on — on the television, on the stage, on the noticeboard — before assuming a quiet Tuesday. On event nights, the shoulder strategy flips: arrive before the pre-match build if you want a seat, because unlike the Friday wave, the match crowd does not thin until the event ends.
Sunday sessions and the daytime curve
Daytime drinking writes its own curve on the graph. Weekend lunchtimes bring a family-and-food crowd that peaks early and fades by late afternoon, and Sunday sessions in particular run on a slow build from noon to a gentle mid-afternoon plateau — busy enough to feel alive, rarely the crush of a Friday night. Garden and terrace pubs add a weather clause: the first warm weekend of spring can double a Sunday’s crowd, a surge no historical graph predicts because the graph averages the rainy Sundays too. Read the weekly pattern for the baseline, and the forecast for the truth.
Frequently asked questions
What is the busiest night of the week for pubs?
Saturday, in most places, with Friday close behind — and Thursday rivalling both in city centres. The peak usually lands between 9 PM and 11 PM.
Is happy hour actually a good time to go?
For prices, yes; for space, often no. The calmest good-value window is frequently the hour right after happy hour ends, before the late crowd builds.
Why does my local show as busiest on a random Tuesday?
Almost certainly an event — a quiz, a team night, a televised match. Weekly events bake into the graph exactly like weekend crowds do.
Do bars show live busyness on Google Maps?
Busy venues usually do during opening hours. Smaller locals may show only the typical graph, which for a rhythm this regular is still a reliable guide.
Conclusion
Bars and pubs busiest nights follow a score anyone can learn: quiet Mondays, a Wednesday hinge, a Thursday climb, and the Friday–Saturday summit, with happy hour pulling the weekday peak earlier and events striking their own extra peaks on top. Read your venue’s graph for its personal version of the rhythm, use the live bar at the evening’s edge, and you can choose your pub the way regulars do — the same favourite bar, at the hour when it feels like yours.
